

- Bitcoin’s UTXO loss-to-profit ratio has reached levels linked to severe market stress.
- BTC failed to hold above $65,000, leaving $67,500-$68,000 as the next key upside zone.
- Support near $59,904 remains important as losses among holders rise across the Bitcoin network.
Bitcoin holders are facing rising unrealized losses as on-chain data shows a sharp increase in unprofitable UTXOs. Market analyst Darkfost said the loss-to-profit ratio has entered an extreme zone associated with severe market stress.
The signal arrives as BTC price struggles around $64,630 after failing to maintain the $65,000 level. However, Kalshi traders forecast a monthly high near $68,000, while the chart shows several nearby barriers.
Bitcoin UTXO Loss Ratio Signals Growing Market Stress
Darkfost’s chart measures the number of UTXOs in profit against those in loss. Unlike dollar-based calculations, the ratio focuses on wallet outputs and avoids distortions caused by Bitcoin’s long-term price expansion.
The latest reading shows losses becoming increasingly dominant across held outputs. Similar spikes appeared during periods of stress across previous market cycles, including extended bearish phases and major corrections.
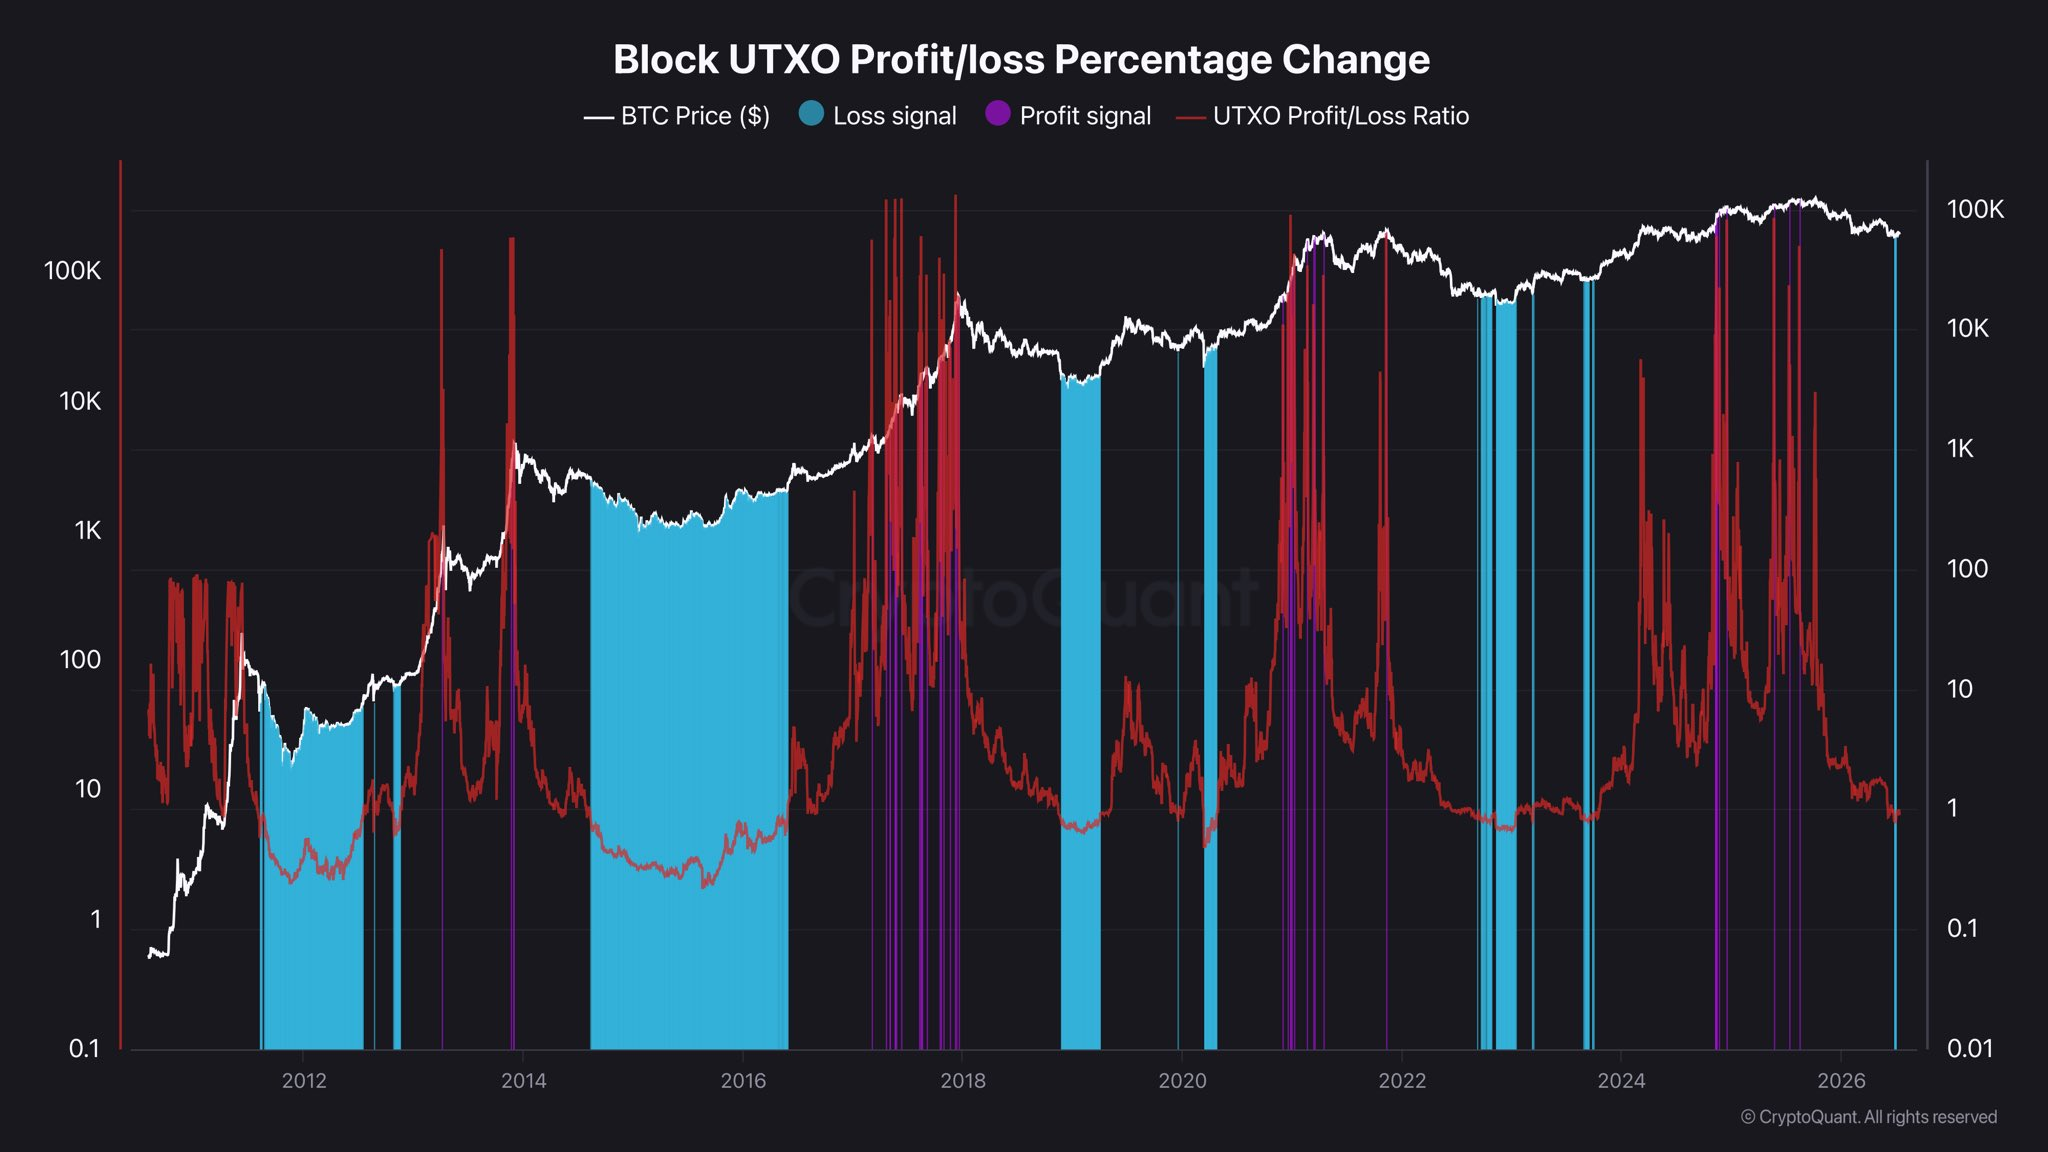
Even so, the indicator does not identify an exact market bottom. Instead, it shows that a growing share of holders controls coins below their acquisition value.
Darkfost described the current condition as favorable for long-term accumulation. He also warned that the opposite extreme can emerge when profitable UTXOs dominate, and market euphoria becomes widespread.
That contrast makes the ratio a behavioral gauge rather than a direct price target. It tracks whether market participants are holding gains or absorbing losses across the network.
BTC Faces $65K Resistance With $68K Still in Focus
Meanwhile, Ted reported that BTC attempted to hold above $65,000 but failed. His chart placed the market near $64,630, with the rejected zone remaining the first short-term barrier.
According to his analysis, a daily close above that area would reopen the path toward $67,500 and $68,000. That range aligns with the monthly high forecast reported by Whale Insider based on Kalshi traders.
The chart also marks higher resistance near $70,672, followed by levels around $75,297 and $81,454. On the downside, the same chart identifies support near $59,904. Additional demand zones appear between $55,123 and $56,586, with a lower level near $52,507.
Overall, holder losses are deepening, while price remains capped below a key daily resistance zone. The next confirmed move, therefore, depends on whether Bitcoin secures a close above $65,000 or retreats toward the marked support levels.
Related: Bitcoin Sets Up a Reversal Pattern Amid Fading Sell Pressure
Disclaimer: The information presented in this article is for informational and educational purposes only. The article does not constitute financial advice or advice of any kind. Coin Edition is not responsible for any losses incurred as a result of the utilization of content, products, or services mentioned. Readers are advised to exercise caution before taking any action related to the company.