

- Bitcoin’s MVRV percentile near 5% reflects valuation levels rarely seen in past cycles.
- Darkfost’s chart shows current MVRV remains well below historical market top zones.
- Ansem’s fractal mirrors the 2024 recovery with higher highs after reclaiming $74,224.
Bitcoin’s latest market structure is on spot after two separate chart analysis highlighted conditions that differ from previous cycle peaks despite the asset’s continued price strength. One analysis shows Bitcoin’s MVRV percentile remaining near historically low levels even as the cryptocurrency trades near the upper end of its long-term price range.
Another compares the current price action with the market recovery that followed Bitcoin’s 2024 bottom near $58,000, identifying similarities in the trend that developed after an extended consolidation period.
MVRV Percentile Returns to Capitulation Zone
Crypto analyst Darkfost said Bitcoin’s MVRV percentile has once again fallen into a historically low range, following its previous capitulation in February, when Bitcoin dropped below $60,000. According to the analysis, the same dynamic has been unfolding since June.
Rather than relying on the traditional MVRV ratio, the chart measures where the current MVRV stands relative to its historical distribution. The approach compares Bitcoin’s current price with previous market cycles, providing a percentile ranking rather than focusing solely on the raw metric.
Darkfost explained that the method adds historical context by showing how Bitcoin has traded at similar valuation levels. The current reading sits around the fifth percentile, meaning Bitcoin has spent about 95% of its trading history at a higher MVRV level.
The accompanying chart places Bitcoin’s price alongside its MVRV percentile across multiple market cycles. While Bitcoin remains near the upper end of its historical price range, the MVRV percentile remains within the 0% to 10% zone.
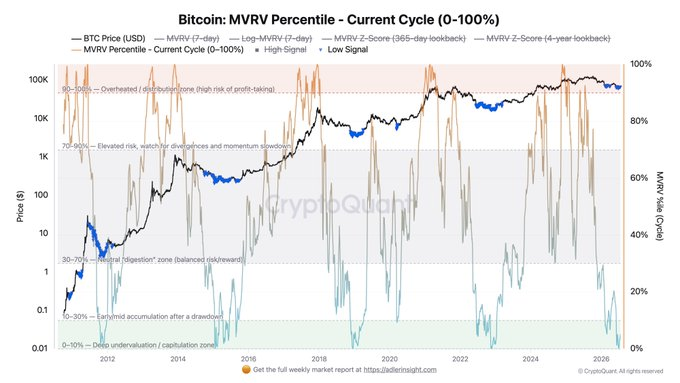
The chart also identifies the 70% to 90% percentile range as an area associated with high profit-taking risk, while readings between 90% and 100% have historically coincided with overheated market phases.
Fractal Comparison Highlights Similar Technical Structure
Separately, market analyst Ansem shared a Bitcoin fractal comparing the current trend to the market recovery following the 2024 bottom near $58,000.
The chart shows Bitcoin first moving through a prolonged corrective period before reaching support in the $60,000 to $63,000 range. After rebounding from that area, the asset reclaimed the $74,224 resistance and continued forming higher highs and higher lows.
Related: Crypto Assets Hit Undervalued Levels: Here Are Top Coins to Consider
Disclaimer: The information presented in this article is for informational and educational purposes only. The article does not constitute financial advice or advice of any kind. Coin Edition is not responsible for any losses incurred as a result of the utilization of content, products, or services mentioned. Readers are advised to exercise caution before taking any action related to the company.