

- Bitcoin fell almost 3% from $86,600 as sellers erased the early-October rebound.
- BTC now faces $80,000-$82,500 support after the sharp four-hour reversal.
- U.S. government-labeled wallets moved over $100M in crypto during the BTC selloff.
Bitcoin’s rebound stalled near $86,600 before a large four-hour bearish candle pushed BTC toward $84,000, giving sellers short-term control.
| CHART PRICE | OCTOBER 6 HIGH | 4H SIGNAL | DOWNSIDE REFERENCE |
| $84,175.70 | $86,600 | Bearish expansion candle | $80,000–$82,500 |
October Bottom FOMO Faces a Sharp Bitcoin Seller Reversal
The supplied Bybit chart shows Bitcoin climbing from late-September levels near $83,000 to an October 6 peak around $86,600. However, momentum then reversed sharply as a large bearish candle dropped from roughly $85,500 toward $84,200.
The following candle produced only a limited recovery. As a result, Bitcoin retreated nearly 3% from the October 6 high. That decline exceeded the shallow intraday rejections recorded during the earlier advance, marking a clear shift in short-term price behavior.
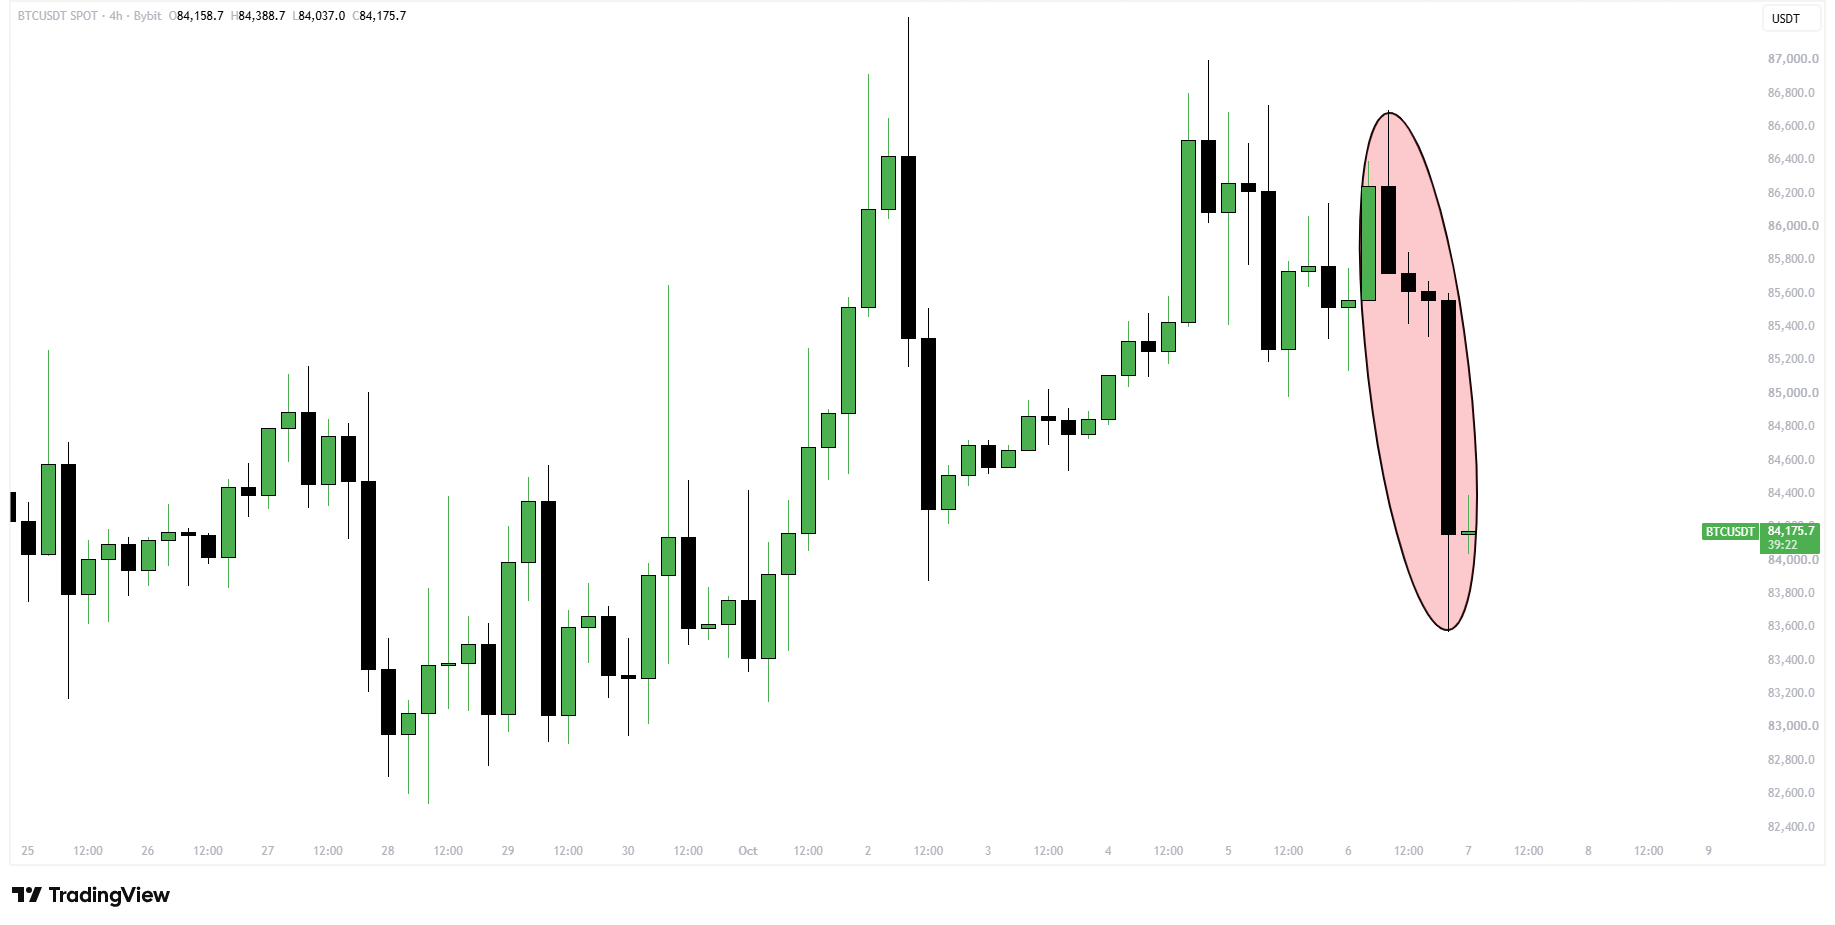
The sequence is consistent with FOMO-driven buying providing liquidity near local highs. However, the chart cannot identify who sold or prove that FOMO directly caused the reversal. Meanwhile, CoinMarketCap placed BTC near $84,200 on Wednesday. Its 24-hour trading range stretched from approximately $83,596 to $86,665.
Cycle-Low Calls Return as Bitcoin Slips From $86,600
That reversal came as renewed attention turned toward Bitcoin’s recurring cycle patterns. A December 2023 4chan post measured roughly 1,064 days from a major low to an all-time high, followed by about 364 days downward.
The post projected October 6, 2025, as a cycle top. CoinGecko later listed Bitcoin’s $126,080 all-time high on that date, giving the projection renewed attention. Applying another 364-day interval points toward early October 2026 as a possible cycle bottom.
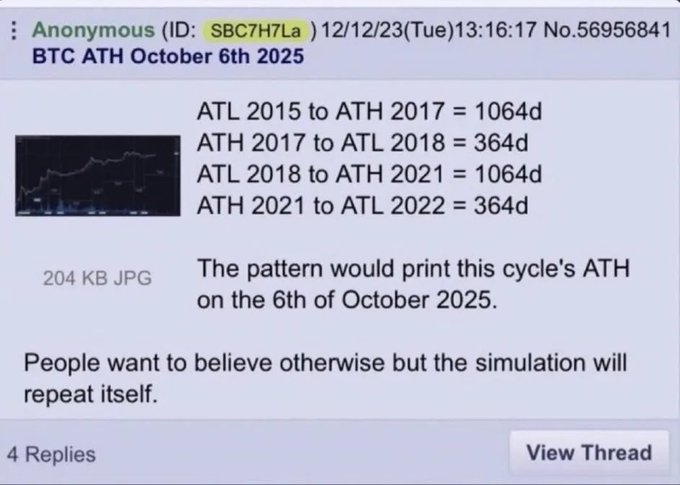
Coin Bureau highlighted that extrapolation this week as BTC pushed toward $86,000. Peter Brandt had also forecast October 4, 2026, as a possible low in July, while warning that Bitcoin could still fall below $50,000 before bottoming.
However, by late September, Brandt said the low might already have formed and that another bull-market cycle had started. That revised view shows how calendar-based projections can change as new price action develops.
$80,000-$82,500 Support Becomes the Key BTC Test
Against that changing cycle outlook, Ash Crypto’s daily chart places $80,000-$82,500 as the immediate support zone after repeated rejection below recent highs. Its Relative Strength Index sits near 66, remaining above neutral territory even as momentum cools.
A break below that zone would weaken September’s recovery and expose lower chart support. Conversely, defending the area would keep the broader rebound structure intact despite the latest decline.
At the same time, another development added to market attention. Arkham-labeled U.S. government wallets moved more than $100 million in cryptocurrency. The transfers included 833.599 BTC worth about $71.6 million and 40,285 BNB valued near $31.6 million.
The Bitcoin later reached addresses that Arkham identifies as Coinbase Prime deposit addresses. However, a transfer to Coinbase Prime does not confirm a sale. Moreover, no evidence directly links those transactions to Bitcoin’s latest decline.
Levels That Decide Whether the Trap Deepens
| LEVEL | ROLE IN THE CURRENT SETUP |
| $86,600 | Local rejection high and bearish invalidation reference |
| $85,500–$86,000 | First reclaim zone after the breakdown |
| $83,000 | Seller-controlled confirmation level |
| $80,000–$82,500 | Broader support zone on the daily chart |
DOWNSIDE EXPANSION CASE
Failure to reclaim $85,500–$86,000 keeps the rejection intact. Moreover, a sustained move below $83,000 would strengthen seller control and expose $80,000–$82,500.
FAILURE CASE
Meanwhile, a recovery through $85,500–$86,000 would weaken bearish structure, while reclaiming $86,600 would invalidate the rejection and reduce the trapped-buyer argument.
BOTTOM LINE
Overall, Bitcoin’s October-bottom narrative met a sharp four-hour reversal near $86,600, shifting short-term momentum toward sellers. As long as BTC’s price remains below the reclaim zone, sellers retain the near-term advantage.
Meanwhile, the FOMO-trap argument would gain further weight if Bitcoin falls below $83,000. However, the chart cannot identify who sold or prove that the October-bottom narrative directly caused the decline.
FAQs
It marks the local rejection before the 4-hour decline accelerated.
A sustained break below this zone would strengthen seller control.
The daily chart identifies $80,000–$82,500 as the support zone.
Its size exceeded preceding pullbacks and marked bearish expansion.
A recovery through $85,500–$86,000, followed by a reclaim of $86,600, would weaken the structure.
Related: USD/INR Hits Two-Month High as US-India Trade Impasse Deepens Rupee Risks
Disclaimer: The information presented in this article is for informational and educational purposes only. The article does not constitute financial advice or advice of any kind. Coin Edition is not responsible for any losses incurred as a result of the utilization of content, products, or services mentioned. Readers are advised to exercise caution before taking any action related to the company.