






- Bitcoin ETFs posted three consecutive daily inflows, the first such streak since May 4-6, ending an 8-week selling run exceeding $8.6B
- BlackRock’s IBIT led with $54.80M on July 7 as total daily inflows hit $21.44M
- US and Iranian forces exchanged fresh strikes overnight, pushing oil up 3.3% and lifting the dollar
Bitcoin trades at $62,741.45 on July 8, down 0.92%, after getting rejected at the top of its descending channel even as ETF inflows turned positive for a third straight session.
Is BTC Getting Rejected At The Channel Top Again?
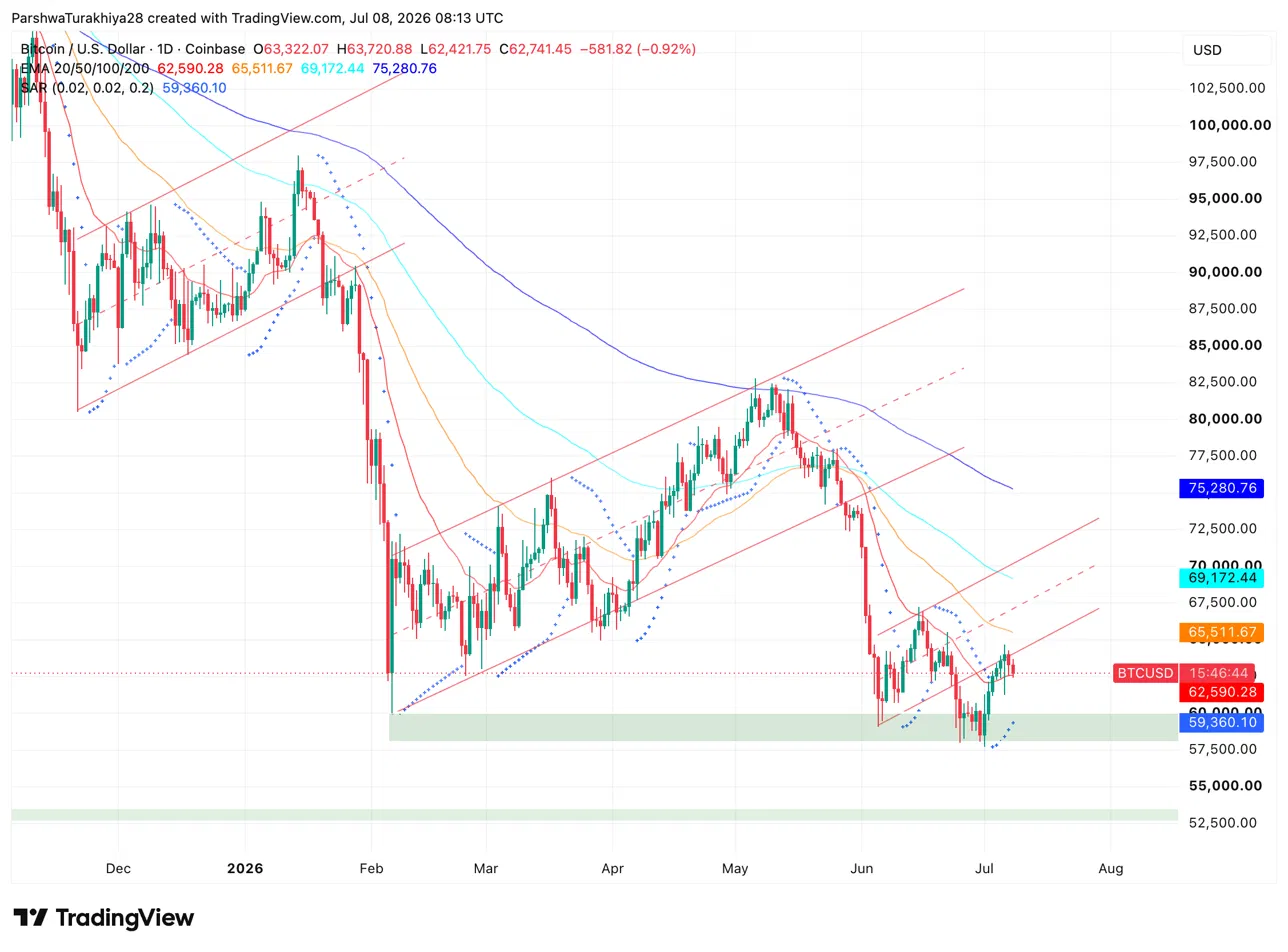
The daily chart shows BTC inside a descending channel that has broken down three times in 2026, with price currently pressing against the upper trendline after recovering from the June 25 low near $58,000. Analyst Ali Charts flagged the rejection explicitly, noting BTC is getting turned away at the channel’s upper boundary and identifying $59,700 as the immediate pullback target and $56,550 as the next downside level if that doesn’t hold.
Related: Ethereum Price Prediction: Bulls Target $1,802 Breakout While Sellers Remain Active
The Parabolic SAR at $59,360.10 remains below price, keeping the short-term recovery structure intact for now. All four EMAs sit above spot: the 20-day at $62,590.28 is essentially at current price, the 50-day at $65,511.67, the 100-day at $69,172.44 and the 200-day at $75,280.76 overhead.
What Are The Key Support And Resistance Levels For BTC Today?
- Support at $59,700 on the channel mid-point and $59,360 on the SAR
- Resistance at $62,590 on the 20-day EMA and the channel’s upper trendline near $63,700
Why Do Three Straight ETF Inflows Matter For Bitcoin?
US spot Bitcoin ETFs recorded $21.44M in net inflows on July 7, the third consecutive day of positive flows following $265.69M on July 6 and $221.72M on July 2. That three-day streak is the first since May 4, 5 and 6, breaking an eight-week run of outflows that drained more than $8.6 billion from the funds.
BlackRock’s IBIT led July 7 with $54.80M, though Fidelity’s FBTC saw $24.92M in outflows and ARK’s fund lost $8.44M, keeping the net total modest. Cumulative inflows across all funds now stand at $51.37B with total net assets at $77.26B. Three days doesn’t confirm a trend reversal, but the prior streak ending in early May preceded a rally to $83,000, giving bulls a historical reference point even if the macro backdrop is considerably noisier now.
How Are US-Iran Tensions Affecting Bitcoin’s Price?
Iran’s Revolutionary Guards struck US military sites in Bahrain and Kuwait overnight after the US launched a wave of strikes against Iran in response to tanker attacks in the Strait of Hormuz. Brent crude jumped 3.3% to $76.59 a barrel on the news while the dollar firmed to its highest level in a week.
Risk assets tend to struggle when geopolitical uncertainty spikes alongside a stronger dollar, and crypto is no exception. Analysts at DBS noted markets appear to be treating the exchange of strikes as tactical positioning ahead of the mid-August ceasefire expiry rather than a full return to open conflict, which limits the immediate damage but keeps the risk premium elevated.
What Do BTC Derivatives Show About Current Positioning?
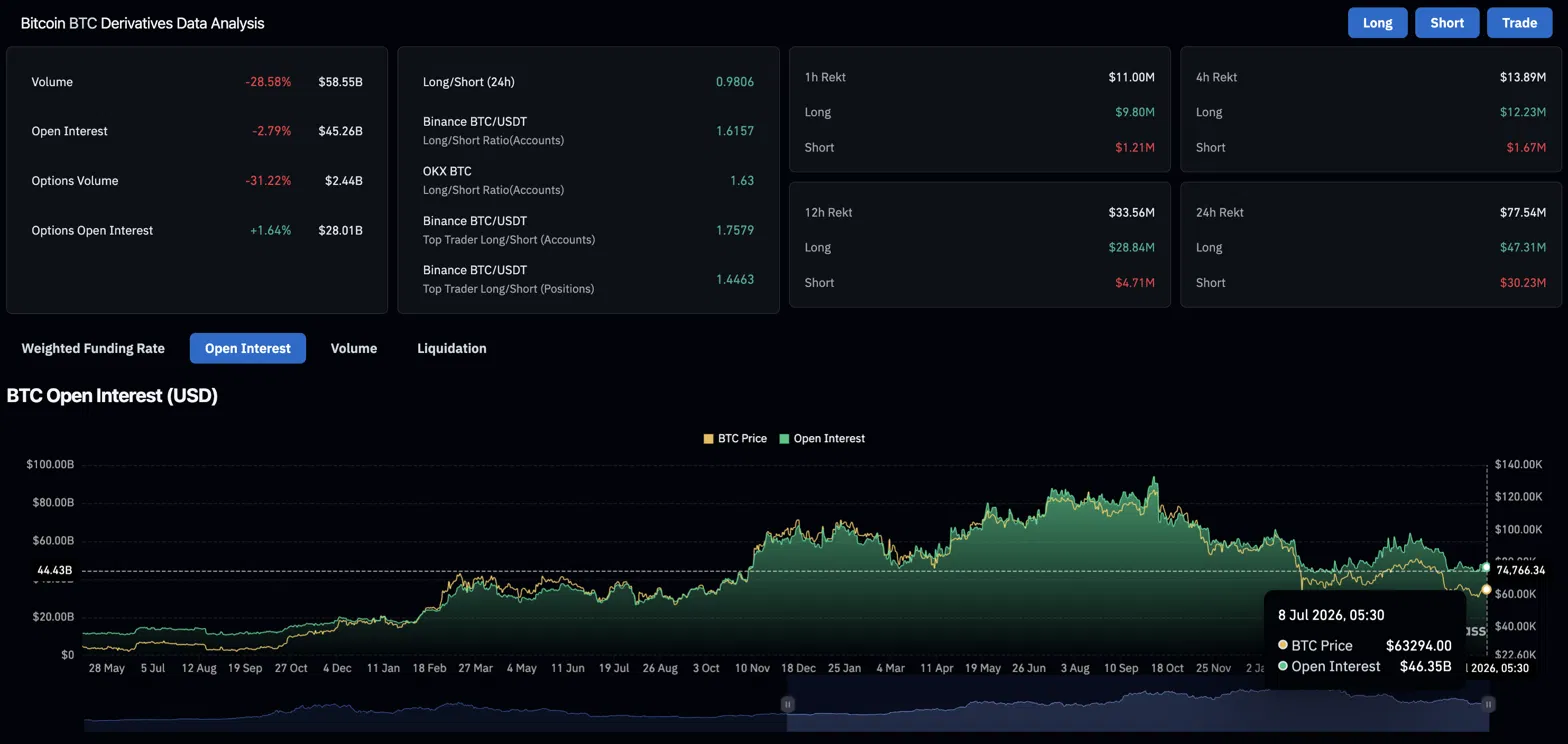
Volume fell 28.58% to $58.55B while open interest dropped 2.79% to $45.26B, both declining together as traders step back. Liquidations over 24 hours hit $77.54M, longs losing $47.31M against $30.23M for shorts, showing buyers who chased the recovery are getting caught on the pullback.
The long/short ratio at 0.9806 is near balanced, with neither side in clear control at current levels.
Bitcoin Price Prediction: Upside and Downside Targets
- Upside case: The ETF inflow streak extends to four days, the channel top breaks on volume, and BTC targets $65,511 on the 50-day EMA as the next recovery milestone.
- Downside case: The channel rejection holds, geopolitical risk keeps dollar strength elevated, and BTC pulls back to $59,700 as Ali Charts flagged, with $56,550 as the deeper target if that fails.
Related: Shiba Inu Price Prediction: Can Robinhood’s 109M SHIB Burn Break the Triangle Before It Breaks Down
Disclaimer: The information presented in this article is for informational and educational purposes only. The article does not constitute financial advice or advice of any kind. Coin Edition is not responsible for any losses incurred as a result of the utilization of content, products, or services mentioned. Readers are advised to exercise caution before taking any action related to the company.




