



- Bitcoin trades below all four major EMAs, with $73,899 support critical to preventing further losses.
- Open interest has declined to $50.57 billion, signaling reduced leveraged trading participation.
- BTC recorded $25.78 million in net inflows, suggesting renewed exchange deposits and selling risks.
Bitcoin continues to face strong selling pressure as its price struggles to regain the $76,000 level, raising concerns about another downward move. BTC traded around $74,322 on November 9, extending its recent decline below an important support zone. Moreover, weakening derivatives activity suggests traders remain cautious about opening new positions.
Bitcoin Sellers Maintain Control Below Major EMAs
Bitcoin’s daily chart continues to display a bearish structure, characterized by lower highs and lower lows. The cryptocurrency has also fallen below its 0.236 Fibonacci retracement level near $76,600.
Significantly, BTC trades below its four major exponential moving averages (EMAs). The 20-day EMA stands at $78,116, while the 50-day EMA sits at $79,279. Additionally, the 100-day EMA and 200-day EMA remain at $77,610 and $76,490, respectively.
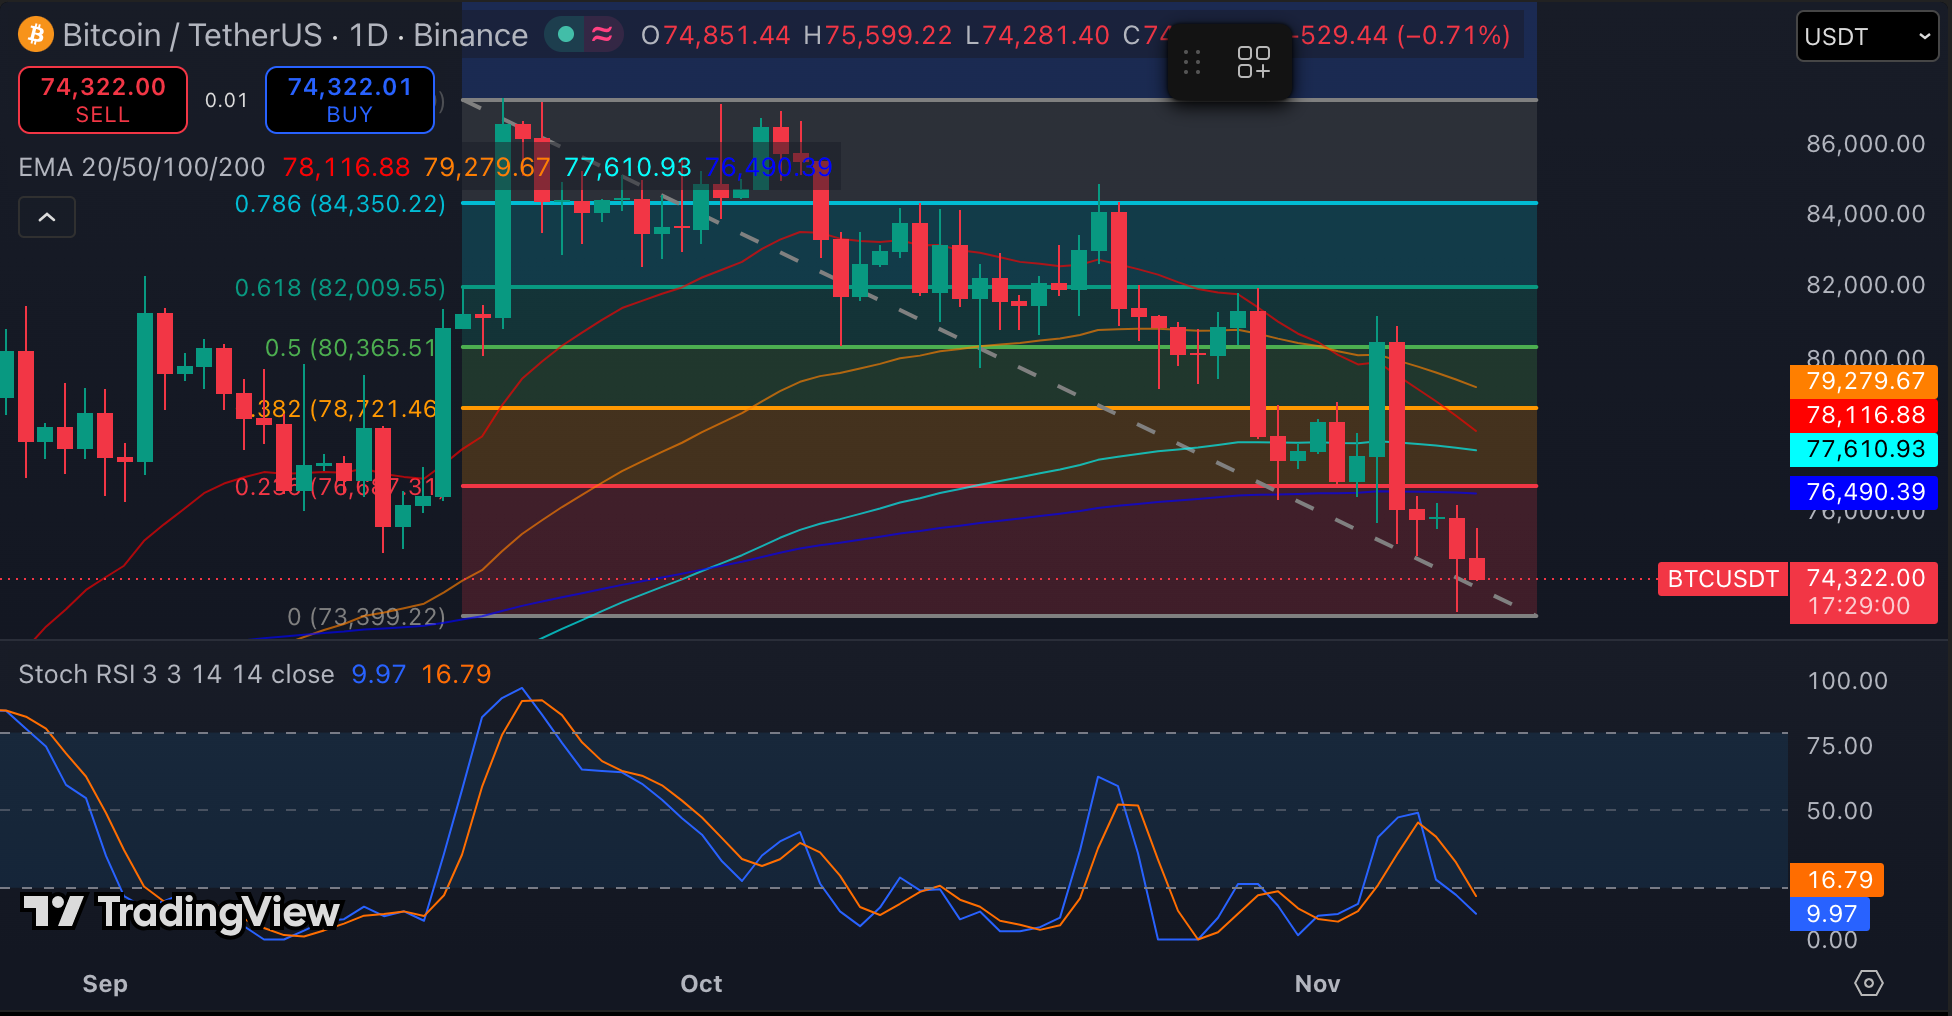
This arrangement creates multiple resistance barriers that could limit recovery attempts. The immediate support stands at $73,899, where buyers must prevent another decisive breakdown.
A daily close below this level could expose Bitcoin to further losses. Hence, traders may watch $71,777 as the next downside reference.
However, a recovery above $76,490 could improve short-term sentiment. Bitcoin would then face resistance between $78,116 and $78,721. Moreover, the 79,279–80,365 region presents another significant challenge.
Related: Janction (JCT) Price Prediction & Forecast 2026, 2027, 2028, 2029, 2030
The Stochastic RSI currently reads 9.97, with its signal line at 16.79. Both readings indicate deeply oversold conditions below the 20 threshold. Nevertheless, oversold momentum alone cannot confirm a bullish reversal.
Bitcoin Open Interest Signals Reduced Derivatives Participation
Bitcoin’s derivatives market also reflects weakening trader participation following its recent price decline. Open interest has fallen considerably from its September peak above $90 billion.
The latest reading stands around $50.57 billion, compared with $73.98 billion in the previous chart reading. This contraction suggests traders have reduced leveraged positions amid uncertain market conditions.
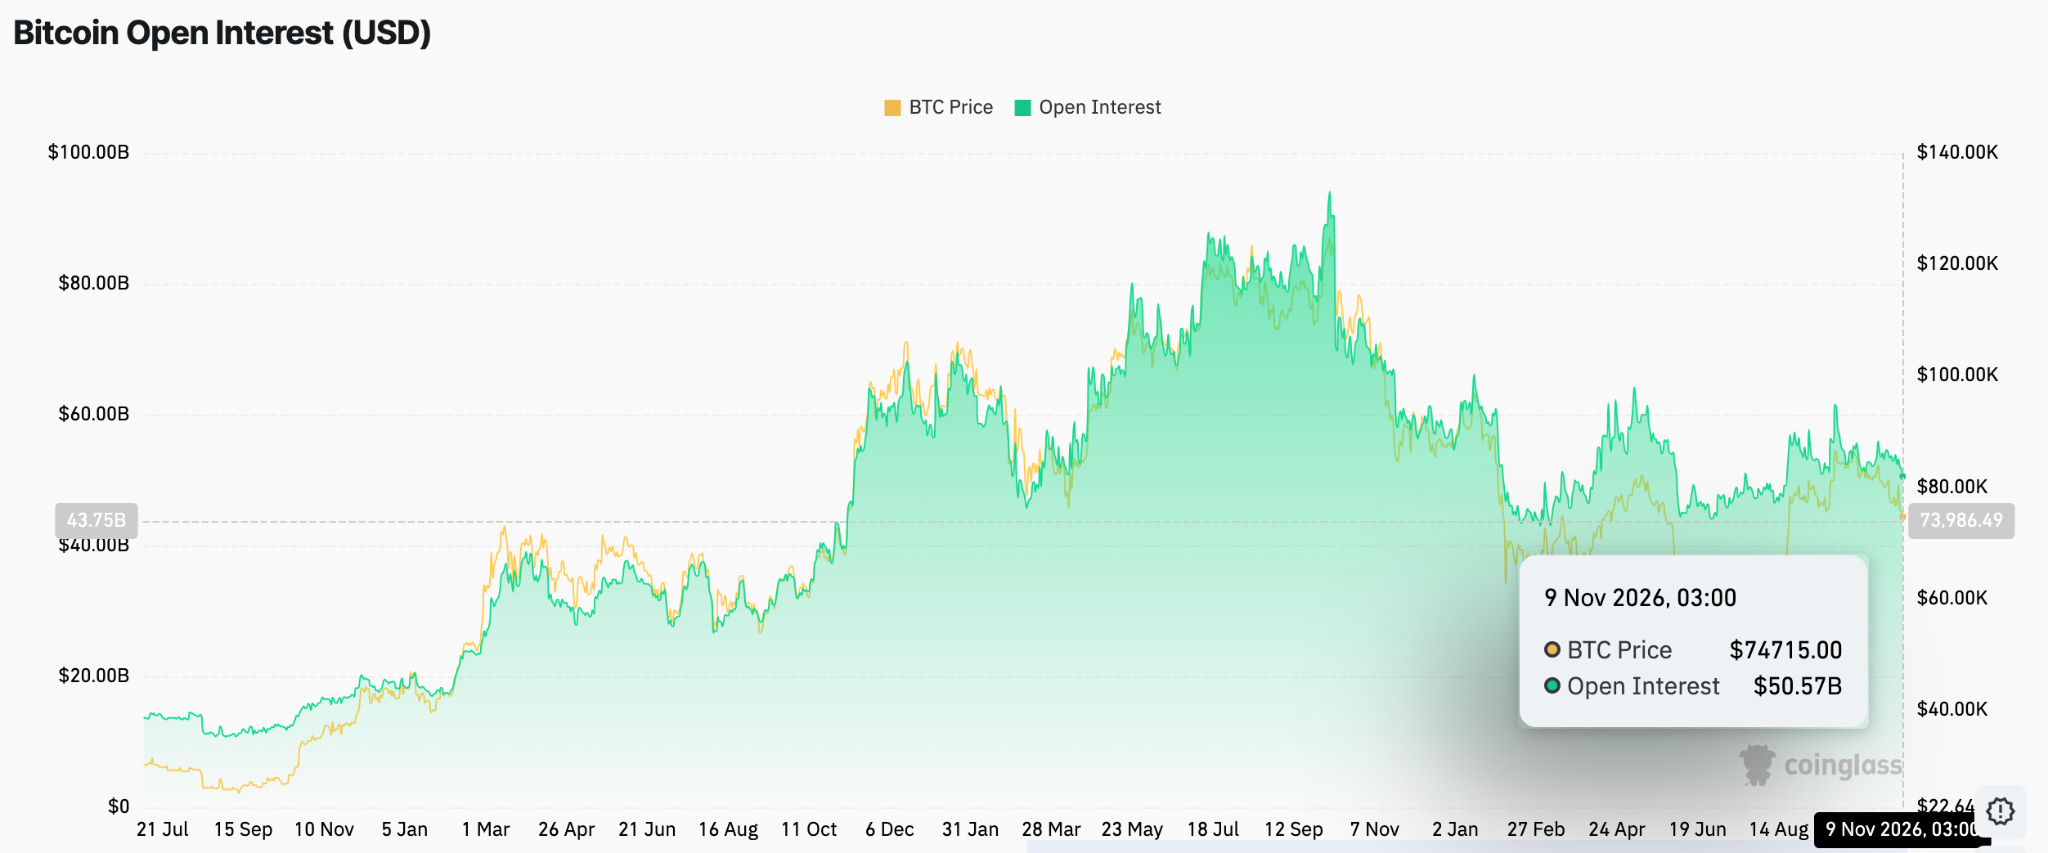
Besides, open interest has struggled to recover despite several attempts at price stabilization. Consequently, speculative demand remains relatively subdued.
A sustained increase in open interest could indicate renewed market participation. However, traders should assess whether rising activity accompanies stronger buying pressure or renewed short positioning.
Bitcoin Exchange Flows Reflect Mixed Investor Sentiment
Bitcoin’s spot exchange flows continue to show inconsistent investor behavior. The market has experienced alternating inflows and outflows throughout the observed period.
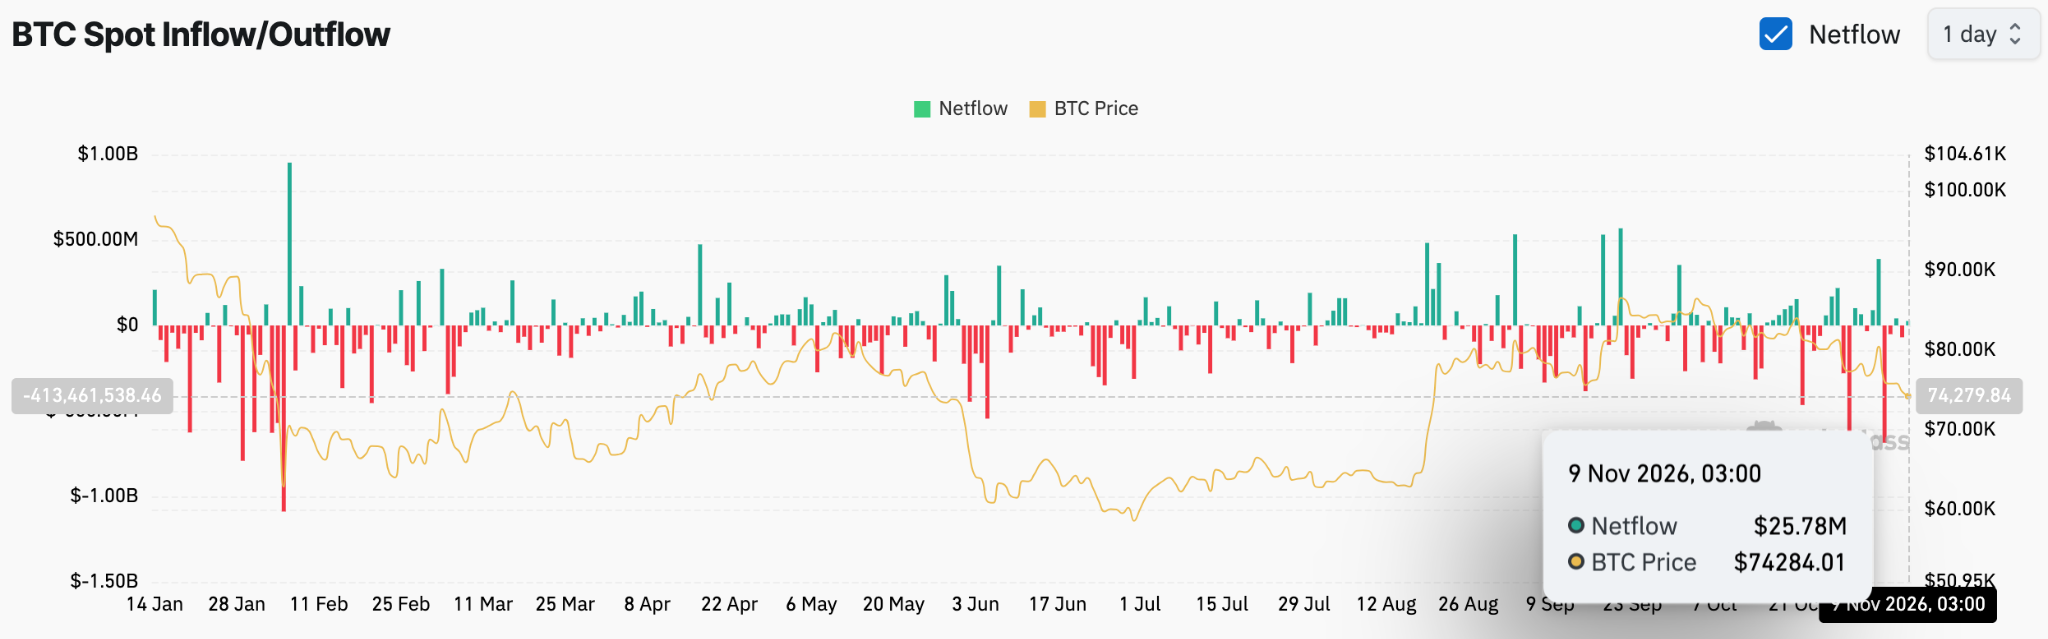
Negative netflow spikes in January, February, June, and October indicate substantial Bitcoin withdrawals. Such movements can suggest accumulation and reduce the immediate supply available for exchange-based selling.
Related: Pepe Price Prediction November 2026: Will PEPE Break Out in November as Volume Jumps 95%?
However, positive spikes during February, April, August, and September indicate renewed exchange deposits. These movements could increase potential selling pressure when investors transfer BTC onto trading platforms.
On November 9, Bitcoin recorded approximately $25.78 million in net inflows. This relatively modest increase suggests continued exchange activity despite the broader market weakness.
Technical Outlook for Bitcoin Price
Key levels remain well-defined as Bitcoin trades near $74,322:
- Upside levels: $76,490-76,600 represent the immediate recovery hurdles. A breakout could extend toward $78,116, $79,279, and $80,365. Further bullish momentum could target $82,009 and $84,350.
- Downside levels: $73,899 represents immediate support, followed by $71,777 if sellers trigger a decisive breakdown.
- Resistance ceiling: $76,490 (200-day EMA) is the first major level Bitcoin must reclaim. The 20-day EMA at $78,116 and 50-day EMA at $79,279 remain additional barriers to recovery.
The technical picture highlights a sustained bearish structure, with BTC trading below all four major EMAs. Meanwhile, the Stochastic RSI remains deeply oversold, suggesting potential for a short-term relief bounce.
Outlook: Will Bitcoin Go Up?
Bitcoin’s price prediction hinges on whether buyers can defend $73,899 and reclaim the $76,490-76,600 resistance cluster. Oversold momentum could encourage a recovery attempt, particularly if buying activity strengthens. However, declining open interest and mixed exchange flows indicate limited conviction among market participants.
A successful recovery above $76,490 could expose $78,116 and $79,279. Breaking $80,365 would provide stronger evidence of improving bullish momentum. Conversely, losing $73,899 could expose Bitcoin to $71,777 and potentially deeper losses.
Related: Ethereum Price Prediction: ETH Faces Further Downside as Vitalik Buterin Questions Fee Burning
For now, Bitcoin remains at a critical decision point. Oversold conditions offer some recovery potential, but technical confirmation and renewed buying pressure will determine its next major move.
Disclaimer: The information presented in this article is for informational and educational purposes only. The article does not constitute financial advice or advice of any kind. Coin Edition is not responsible for any losses incurred as a result of the utilization of content, products, or services mentioned. Readers are advised to exercise caution before taking any action related to the company.