



- Bitcoin is testing a key support zone between $67,000 and $75,000 amid ongoing selling pressure.
- The $70,900-$72,500 range could attract buyers and provide a base for a potential recovery.
- A successful rebound may push BTC toward $87,500, while a drop below $67,000 weakens the bullish outlook.
Bitcoin has fallen back to an important price area linked to its 2024 all-time high. This has brought a key technical support zone into focus as BTC continues its recent decline.
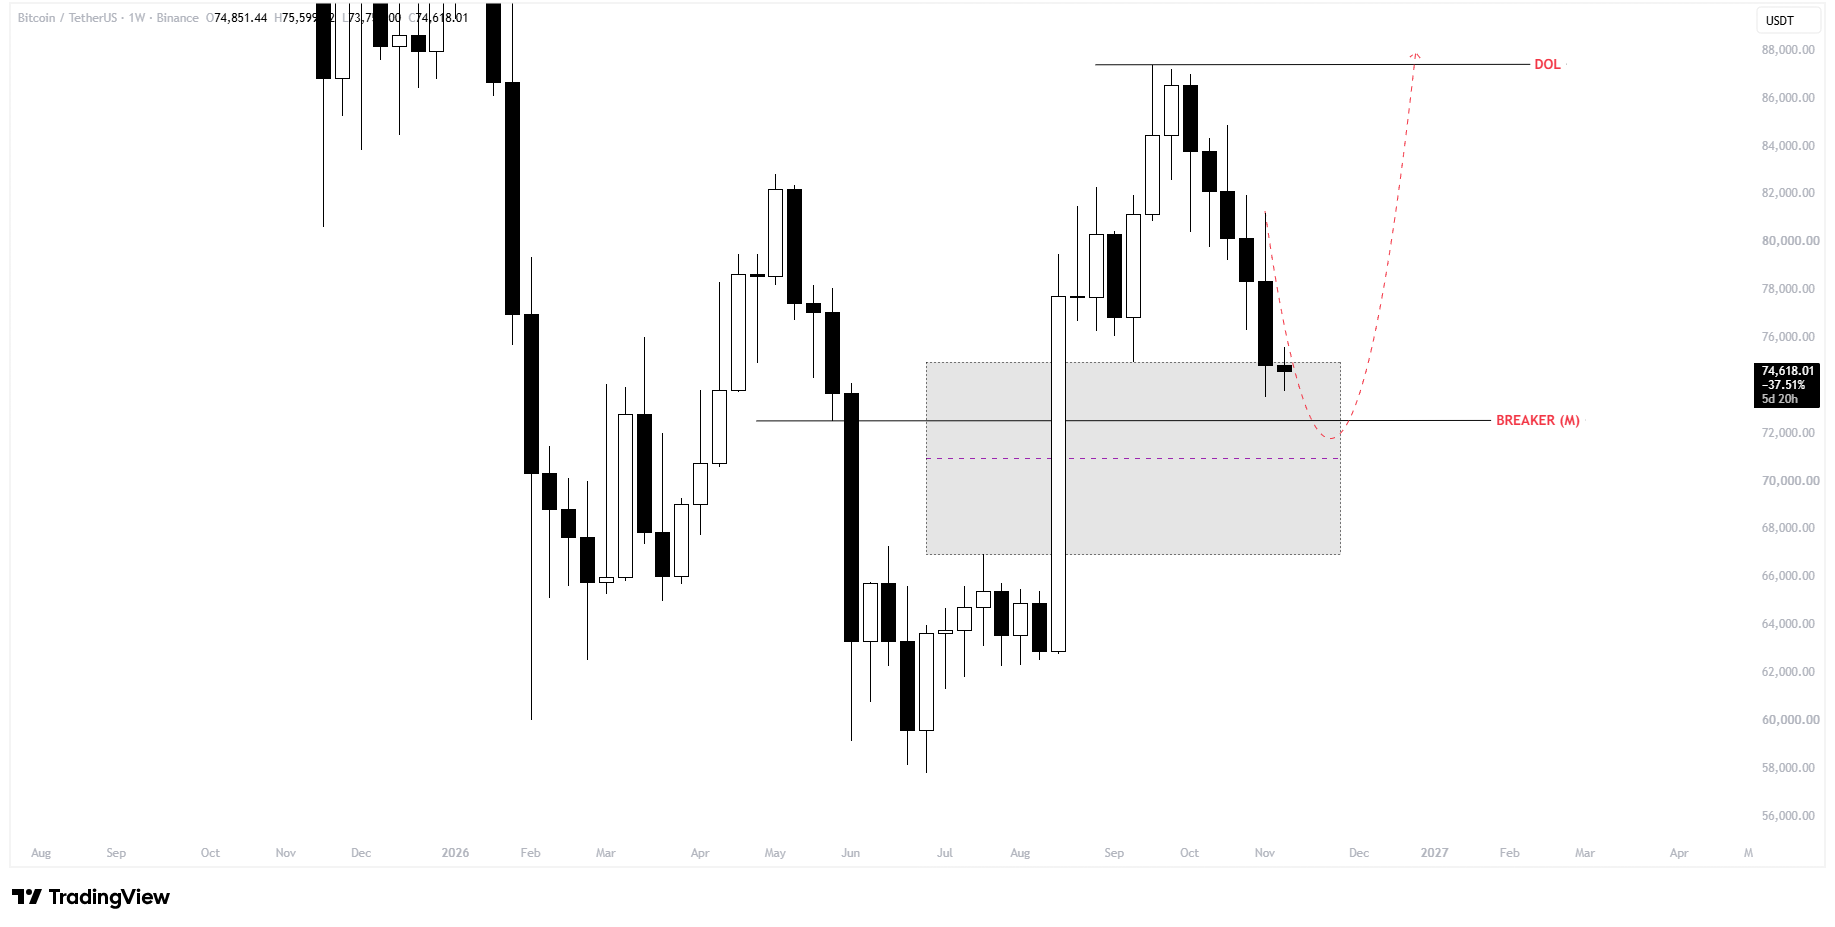
On the weekly Binance chart, Bitcoin is trading around $74,618, down from a recent high of approximately $87,500.
However, the price has now entered a key support zone where buyers could step in. This area includes a monthly breaker block and a weekly Imbalance Fair Value Gap (IFVG), two technical indicators that traders are watching.
The main levels to watch are:
- $72,500: The key monthly breaker level.
- $67,000-$75,000: The broader support zone.
- $70,900: The weekly imbalance level.
If Bitcoin briefly drops below this support area to collect liquidity before recovering, it creates an opportunity for buyers to push the price higher.
Bitcoin Returns to Its Previous All-Time High Region
Bitcoin’s return to this price range is significant because it previously played a role in the asset’s rise to its 2024 all-time high. The recent decline has also filled a price imbalance created during the 2024–2025 rally. This suggests that part of the market correction may already be complete.
Instead of viewing the decline as an outright breakdown, traders could see it as a retest of an important historical price area where buyers may return.
Bitcoin’s recent price movement supports this possibility. After dropping to around $58,000 earlier in the year, BTC recovered and climbed to $87,500 around September and October.
However, the rejection at that high has pushed Bitcoin back into the key support zone. The big question now is whether buyers can defend this area and trigger another upward move, or whether Bitcoin will fall further before recovering.
Follow us on X for real-time crypto updates.
Monthly Breaker Block Meets Weekly IFVG
The main level to watch is the monthly breaker block around $72,500. The highlighted support zone stretches from $67,000 to $75,000. Bitcoin is currently trading near the upper end of this range.
Another important level is the weekly IFVG around $70,900. This represents a price gap created during a strong market move. Traders watch these areas because prices often return to them during corrections.
Since the weekly IFVG overlaps with the monthly breaker block, the area between $70,900 and $72,500 could attract buyers.
Bitcoin could even drop below the support zone briefly to collect liquidity before attempting to recover. However, this does not guarantee a reversal. Buyers still need to show enough strength to push the price higher.
Can Bitcoin Recover to $87,500?
The chart identifies $87,500 as Bitcoin’s next major upside target, also known as the Draw on Liquidity (DOL). The expected scenario is that Bitcoin could first drop toward the lower part of the support zone before recovering.
If buyers successfully defend the $72,500 level and push Bitcoin back above important resistance levels, the chances of a move toward $87,500 could improve.
However, there are risks. If Bitcoin falls below the broader support zone, especially below $67,000, the bullish outlook would weaken. This could mean the correction has further room to continue.
Subscribe to our YouTube channel for the latest crypto news.
Related: Bitcoin Faces $57K Risk as Trump’s Political Power Weakens and Democrats Take Congress
Disclaimer: The information presented in this article is for informational and educational purposes only. The article does not constitute financial advice or advice of any kind. Coin Edition is not responsible for any losses incurred as a result of the utilization of content, products, or services mentioned. Readers are advised to exercise caution before taking any action related to the company.