
- Bitcoin trails the S&P 500 by 60%, with analysts watching whether BTC can regain lost market strength.
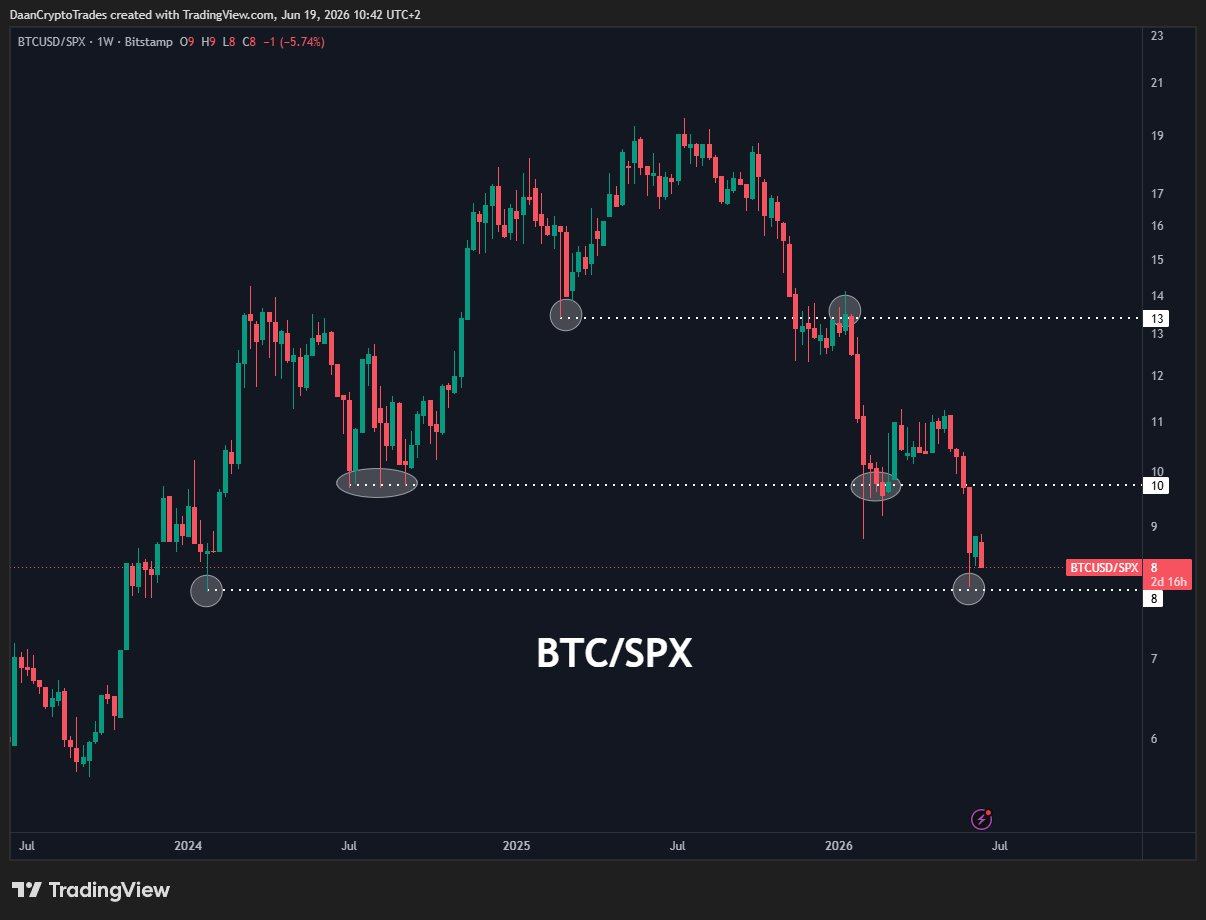
- BTC/SPX ratio shows stocks leading crypto as Bitcoin struggles near key support levels after 2025 highs.
- Bitcoin selling pressure may be easing as fewer investors lock in losses during the latest market decline.
Bitcoin’s performance relative to U.S. stocks has deteriorated sharply, with the cryptocurrency now trading roughly 60% below its previous peak against the S&P 500, according to analysis shared on X by Daan Crypto Trades.
The growing gap reflects a shift in market leadership since Bitcoin’s relative strength peaked in 2025. While Bitcoin continues to lag, the S&P 500 Index has gained more than 9% year-to-date and about 25% over the past 12 months.
Daan Crypto Trades noted that Bitcoin would need to climb to roughly $148,000 to regain the same level of relative strength against the benchmark U.S. stock index that it previously enjoyed.
Bitcoin Loses Ground Against Equity Markets
The gap between the performance of Bitcoin and the U.S. equity market is reflected in the BTC/SPX ratio, a measurement tool used to compare the performance of the Bitcoin and S&P 500 indices. If the ratio increases, Bitcoin is outperforming equities. But a decreasing ratio indicates that stocks are performing better.
The ratio peaked near 19 in mid-2025 before entering a prolonged decline. Since then, the change suggests weaker momentum for Bitcoin compared with stocks by moving below important support levels at 13 and 10, which once sustained the strength of the ratio.
Source: X
The ratio is now approaching the 8 level, which traders view as a key historical support zone. Previous market cycles saw Bitcoin stabilize and recover around similar levels.
Those same levels later became resistance points as Bitcoin struggled to move back above them. The change suggests weaker momentum for Bitcoin compared with stocks and shows that investors have favored traditional equities over digital assets in recent months.
Related: Bitcoin-Altcoin Rotation Weakens as BTC Pair Volumes Remain Near Multi-Year Lows
Analysts Watch for Bitcoin Market Bottom
Signs of panic selling in Bitcoin may be starting to ease, according to CryptoQuant analyst MorenoDV_, who says recent market data suggests fewer investors are rushing to exit their positions during price declines.
The analyst pointed to a drop in realized losses, a metric that measures how much investors lock in losses when selling their holdings. During an earlier downturn, traders realized losses on roughly 400,000 BTC. By comparison, the latest pullback saw that figure fall to about 234,000 BTC, even though Bitcoin traded at similar price levels.
The difference suggests that many of the market’s weaker holders may have already exited during previous sell-offs, leaving fewer investors willing to sell at a loss. As a result, selling pressure appears less intense than it was during the first major downturn.
Related: Analyst Says Bull Markets Last 5x Longer Than Bear Markets: Is Bitcoin Due for a Catch-Up Rally?
Disclaimer: The information presented in this article is for informational and educational purposes only. The article does not constitute financial advice or advice of any kind. Coin Edition is not responsible for any losses incurred as a result of the utilization of content, products, or services mentioned. Readers are advised to exercise caution before taking any action related to the company.
")


