



- Bitcoin rebounded above $58,115 after a dip to $57,800, preserving its six-month range.
- BTC traded near $80,024, below the $82,000–$83,000 resistance and the $97,924 ceiling.
- U.S. spot Bitcoin ETFs recorded $773.5M in outflows over October 22–23, adding pressure.
Bitcoin remains above its six-month range floor at $58,115 after rebounding from an intraperiod dip. At press time, BTC traded near $80,024, while price analysis identifies the $97,924 range high as a potential upper boundary target if buyers sustain support and reclaim key resistance levels.
| Price Level | Technical Significance |
|---|---|
| $97,924 | Six-month range high |
| $87,000–$90,000 | Major resistance |
| $82,000–$83,000 $97,924 | Weekly breaker resistance |
| $78,020 | Six-month midpoint |
| $75,000–$67,000 | Downside support areas |
| $58,115 | Structural range floor |
Six-Month Candle Reclaims $58,115 With $97,924 as Range High
According to TradingView’s Binance chart, Bitcoin fell from its six-month candle opening price of $58,625 to $57,800, briefly slipping below the $58,115 support level. However, buyers pushed BTC back above that boundary, with the price eventually climbing to $87,396 high.
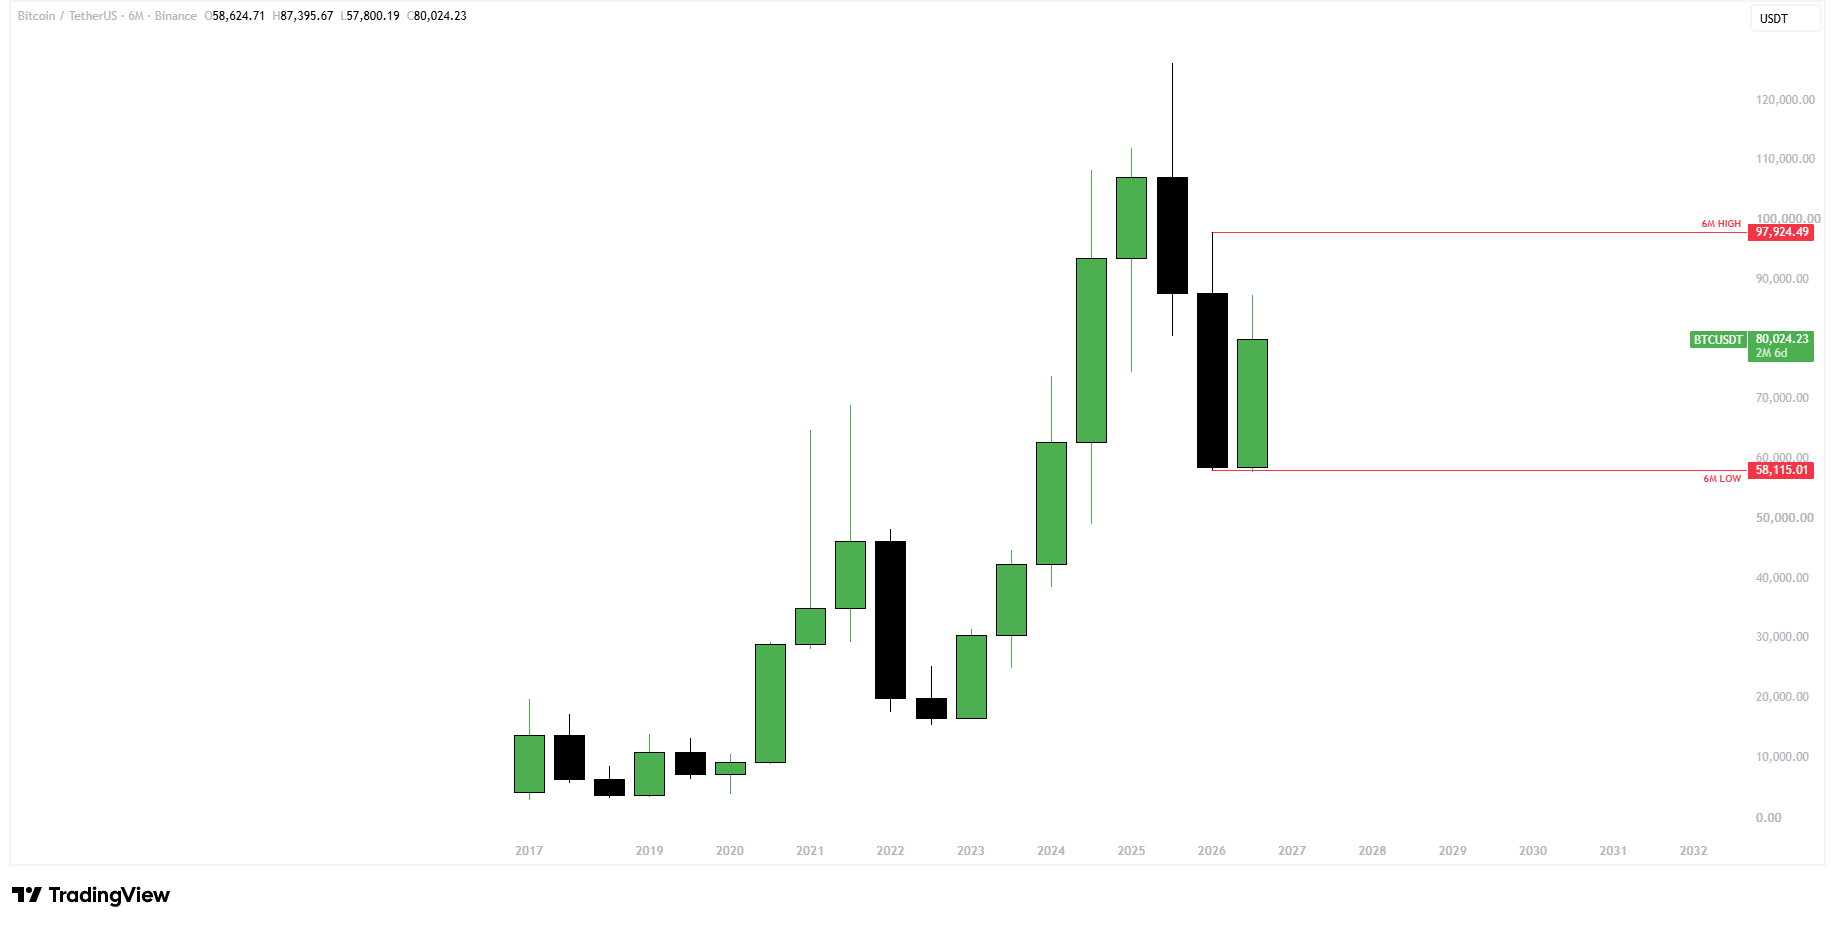
That recovery keeps the wider range intact, although price analysis cannot establish permanent support before the candle closes. Its midpoint near $78,020 divides the structure into upper and lower halves.
As of press time, Bitcoin stood above that midpoint around $80,024, indicating a recovery within the range rather than a breakout. For BTC, price analysis now distinguishes holding the midpoint from clearing the substantially higher $97,924 ceiling.
Weekly Breaker at $82,000–$83,000 Tests Bitcoin’s Recovery
On the weekly chart, Bitcoin remained inside a $78,000–$83,000 breaker zone following October’s retreat from approximately $87,000. BTC therefore faces immediate resistance around $82,000–$83,000, where the chart previously marked a break of structure.
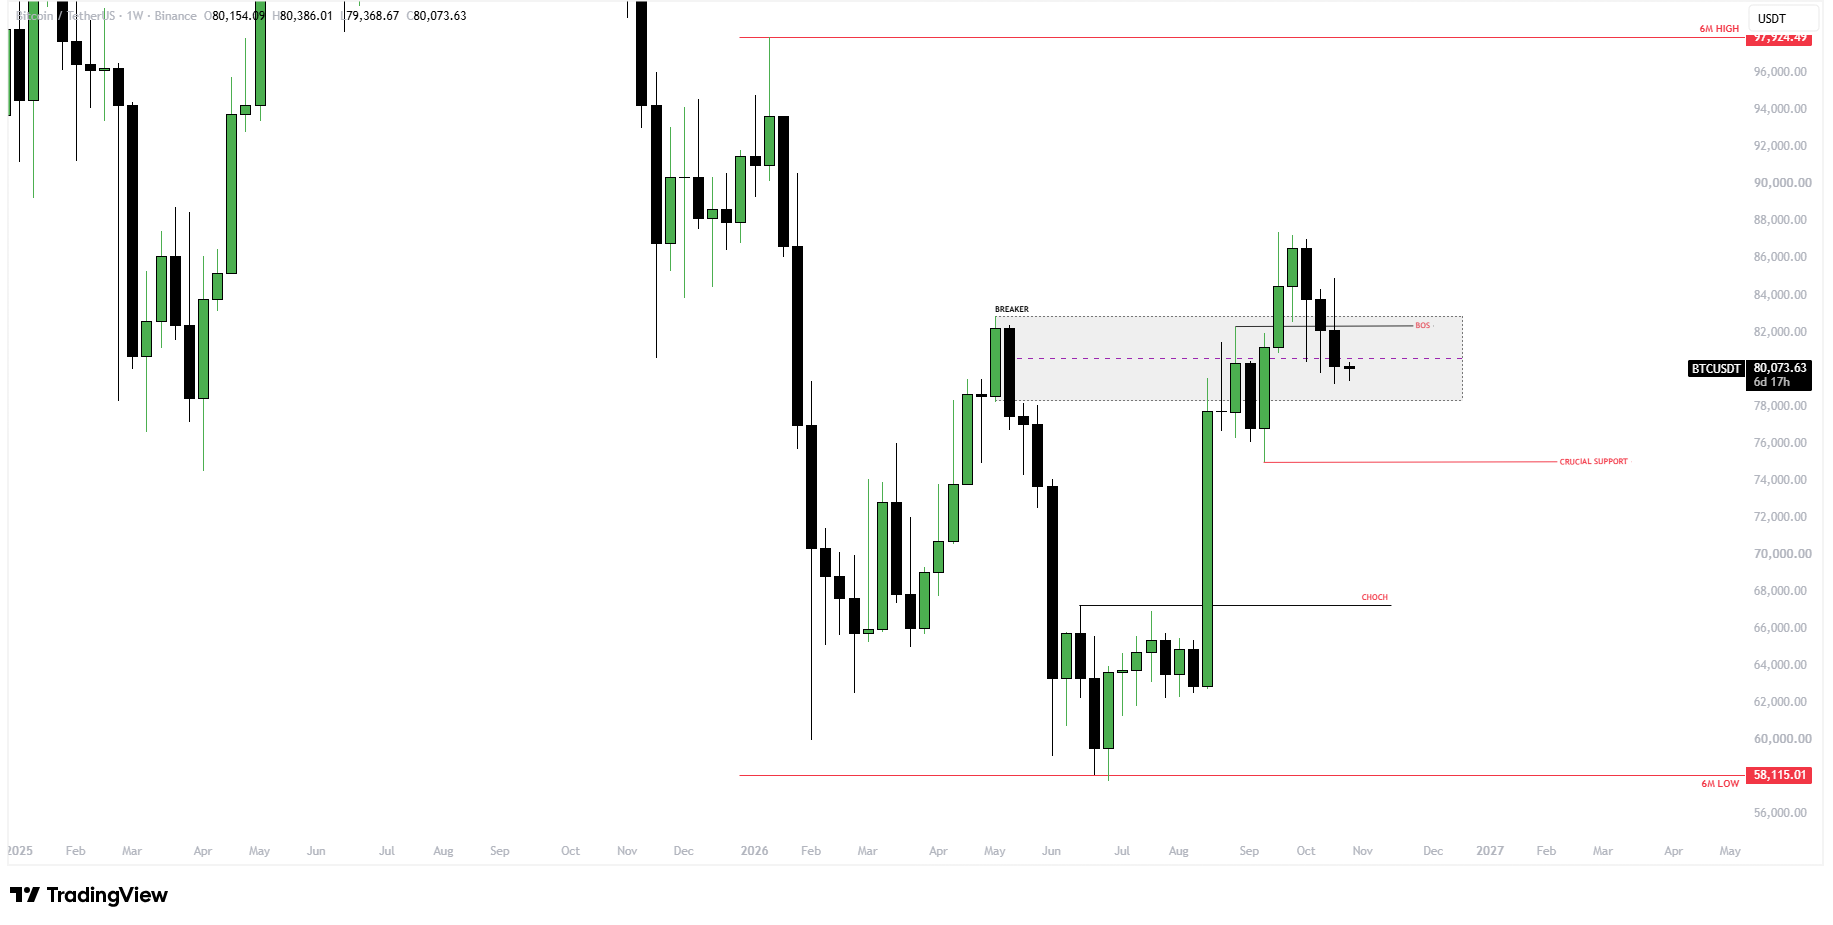
This price analysis places the next resistance band at $87,000–$90,000 before the six-month high. Nevertheless, Bitcoin has not reclaimed those levels, making $97,924 a conditional upside objective.
Meanwhile, a rejection near the breaker would shift attention toward $75,000, followed by the change-of-character area around $67,000. For BTC, price analysis therefore separates a defended range floor from a confirmed weekly bullish trend.
Follow us on X for real-time crypto updates.
Bitcoin Holds Above $80K Support as ETF Outflows and Fed Meeting Loom
That distinction matters alongside Coinbase Institutional’s October 23 commentary, which identified $80,000–$82,000 as near-term support and $73,000–$75,000 as a lower-risk area. The firm also noted that about 2.1 million BTC last moved between $87,500 and $91,700, leaving overhead supply.
ETF flows add another layer of uncertainty. Farside Investors reported $137.9 million in US spot Bitcoin ETF outflows on October 23, continuing the previous day’s $635.6 million in outflows.
With the Federal Reserve meeting scheduled for October 27–28, traders also face another potential source of volatility. Bitcoin remains above its $58,115 six-month floor, but the recovery toward $97,924 would gain stronger technical support only if BTC reclaims weekly resistance.
BTC’s Key Market Indicators
| Indicator | Reading |
| BTC price | $80,024 |
| Overhead supply | 2.1 million BTC |
| October 23 ETF flows | -$137.9 million |
| October 22 ETF flows | -$635.6 million |
| Next Fed meeting | October 27–28 |
Bullish Continuation
Weekly acceptance above $83,000, followed by $87,000–$90,000, strengthens the recovery toward $97,924.
Bearish Breakdown
Yet, a loss of $78,020 exposes $75,000 and $67,000, while a decisive break below $58,115 invalidates the range-floor thesis.
FAQs
It marks Bitcoin’s six-month structural floor, as shown in TradingView’s Binance chart.
No. It remains the conditional upper-range objective.
A sustained BTC weekly close above $83,000 would push Bitcoin to higher resistance levels around $87,000–$90,000.
Coinbase Institutional identified $80,000-$82,000 as BTC’s immediate support zone.
Subscribe to our YouTube channel for the latest crypto news.
Related: Cap (CAP) Price Prediction & Forecast 2026, 2027, 2028, 2029, 2030
Disclaimer: The information presented in this article is for informational and educational purposes only. The article does not constitute financial advice or advice of any kind. Coin Edition is not responsible for any losses incurred as a result of the utilization of content, products, or services mentioned. Readers are advised to exercise caution before taking any action related to the company.