


 Token Surges to New High as Buying Pressure Increases")
- The BitDAO price analysis shows a bullish movement at press time.
- BIT/USD gains value at $0.5733 with an increase of 1.80%.
- Support for the cryptocurrency is present at the $0.5622 level.
The latest BitDAO price analysis shows a strong bullish trend for today as more investors are entering the market and amplifying buying pressure. The bullish rally has pushed the crypto’s price to reach a new high of $0.5733 with an increase of 1.80% in the last 24 hours.
The BIT/USD pair is trading along a bullish trajectory, with a market cap of $1.19 billion, and is ranked 43 on CoinMarketCap’s list of top 100 cryptocurrencies by market cap.
The market cap has also surged by nearly 1.88 percent in the last 24 hours. The trading volume of the pair was seen at $15 million, indicating strong investor interest in the token. The buyers should remain cautious as the coin has recently faced multiple resistance levels that may cap its current gains. The more buying pressure that is seen, the higher chances that it will break through these levels.
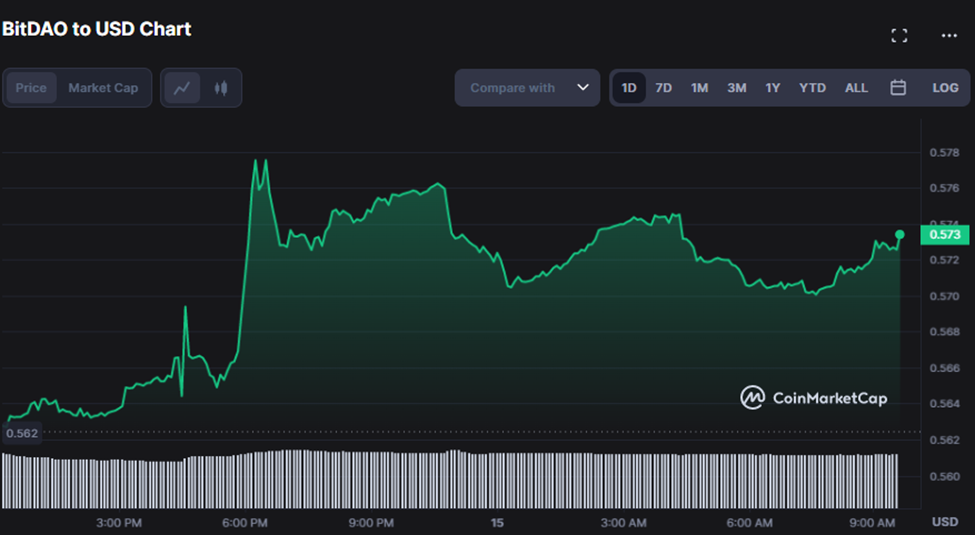
The daily chart for BIT/USD also highlights the upward trajectory of the price and further increases in momentum may be seen over the course of the day. However, there is still some resistance on the upside around $0.5779. On the downside, strong support has been established for around $0.5622, which could prove to be a good entry point for those looking to buy the dip.
Looking at the daily chart for the altcoin, the price is moving above the 20-day simple moving average (SMA) and the 50-day SMA. This indicates that buyers are in control of the market and the uptrend is likely to continue.
The volatility in the market is also increasing and this sentiment could be seen the Bollinger bands widening The upper Bollinger band is at $0.6130, which could be a significant target for traders in the near future, while the lower Bollinger band is at $0.5196 which could act as a support level if the price retraces.
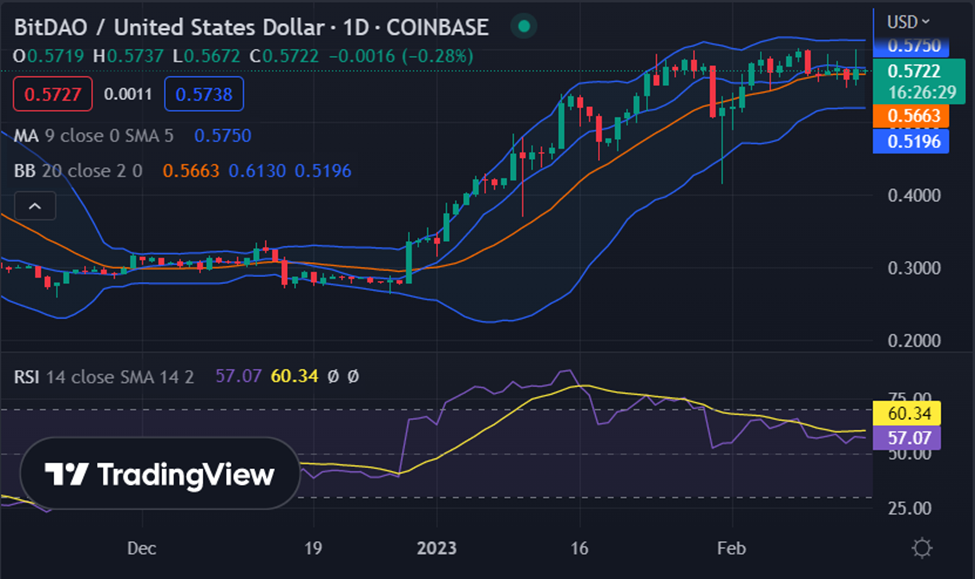
The relative strength index (RSI) score has advanced near the overbought territory at 57.07, signaling that the bullish momentum is strong. The RSI is moving parallel to the horizontal axis, which is a positive sign for the BIT/USD pair.
Overall, with buyers firmly in control and the price surging to new monthly highs, it appears that the bullish trend will remain intact in the near term. Furthermore, support at $0.5622 should be noted for those looking to enter the market, while resistance at $0.5779 should be kept in mind for those who are taking a short-term approach.
Disclaimer: The views and opinions, as well as all the information shared in this price analysis, are published in good faith. Readers must do their own research and due diligence. Any action taken by the reader is strictly at their own risk, Coin Edition and its affiliates will not be held liable for any direct or indirect damage or loss.
Disclaimer: The information presented in this article is for informational and educational purposes only. The article does not constitute financial advice or advice of any kind. Coin Edition is not responsible for any losses incurred as a result of the utilization of content, products, or services mentioned. Readers are advised to exercise caution before taking any action related to the company.


