


- Binance (BNB) price analysis is currently trading around the $305.41 mark.
- BNB/USD trades in a range of $300.02 and $308.90 for the last 24 hours.
- The cryptocurrency shows mixed performance in the last few hours.
Recent Binance (BNB) price analysis shows an uptrend, forming higher lows and highs. Bulls are now trying to break the resistance of $308.90 while maintaining stability above the $305 level. In addition, buyers have managed to move the price above a descending trend which was currently in effect.
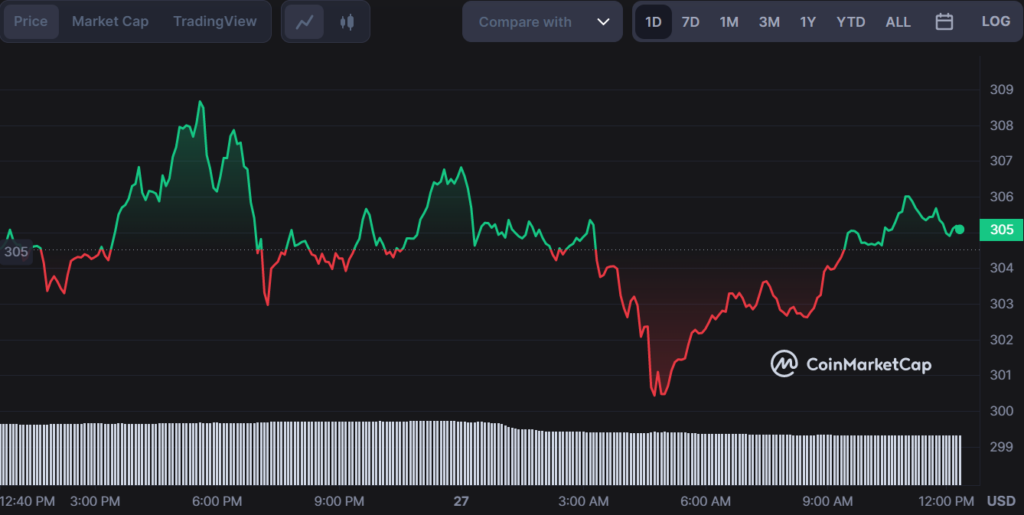
The bearish pressure had pushed the price down to $300 before the buyers stepped in. However, now it looks like a positive shift is beginning to show and an uptrend could be forming. The BNB/USD pair is currently trading well above the key support line at the $300 mark. This indicates that bulls are building up their momentum and could possibly push the asset higher in upcoming sessions, and breaking below the $300 level could indicate a significant bearish trend.
In the near term, if the price continues to stay above $305 then we could say that BNB has found stability and is likely to reach higher levels in upcoming sessions. Furthermore, an increase in volume could further enhance the up-trending market sentiment. The market cap of BNB is currently $48 billion, and the 24-hour volume is reported to be around $505 million. With bullish sentiment growing, the asset could reach further heights in the upcoming days.
Looking at the hourly chart, Binance coin is forming an ascending triangle pattern which is a bullish continuation pattern. This indicates that the bullish momentum is growing and that the price will likely break out in an upward direction soon. The upper trend-line of this triangle pattern coincides with the current $308.90 resistance, which is the next aim for the bulls.
The volatility index for BNB has also been increasing, suggesting that the market activity is picking up. The Bollinger bands also suggest that the Bulls are gaining strength. The upper Bollinger band at $304.9 is an additional indicator that a breakout to the upside could occur soon, while the lower Bollinger band is currently at $395.8.
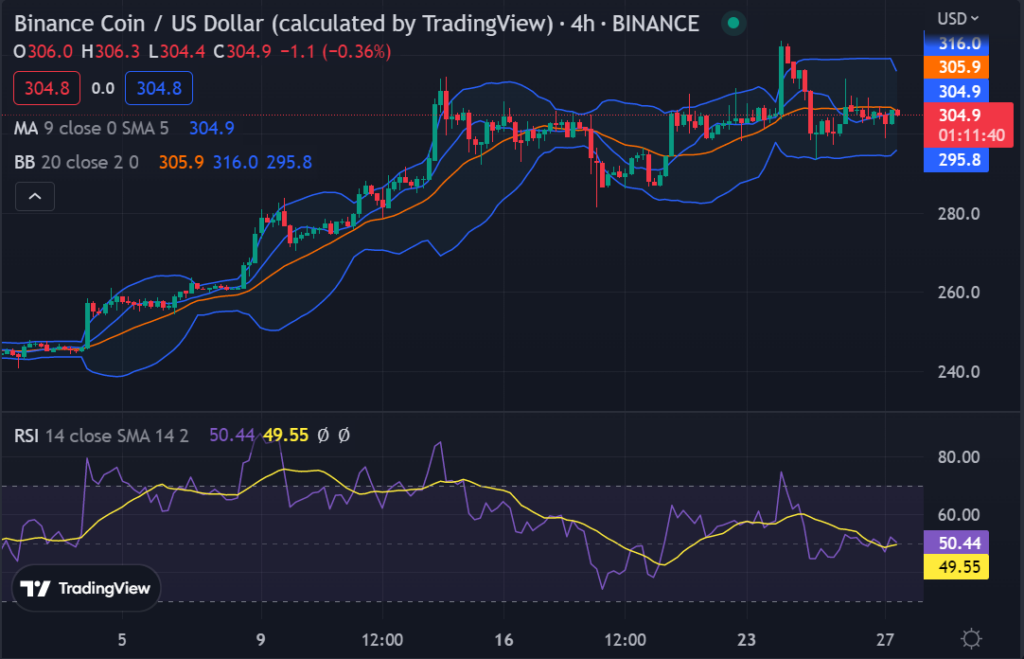
The Relative Strength Index (RSI) is also showing positive signs at 49.55, indicating that buyers are in control of the BNB market. The moving average indicator is currently at $305.89, a sign of neutral sentiment in the BNB market.
Overall, it looks like BNB is well-positioned to continue its uptrend with bulls looking to break the $308.90 resistance. If this happens, we could see a further increase in price. Despite the mixed performance of late, the technical indicators suggest that BNB is in a healthy state and could continue its bullish momentum.
Disclaimer: The views and opinions, as well as all the information shared in this price prediction, are published in good faith. Readers must do their research and due diligence. Any action taken by the reader is strictly at their own risk. Coin Edition and its affiliates will not be held liable for any direct or indirect damage or loss.
Disclaimer: The information presented in this article is for informational and educational purposes only. The article does not constitute financial advice or advice of any kind. Coin Edition is not responsible for any losses incurred as a result of the utilization of content, products, or services mentioned. Readers are advised to exercise caution before taking any action related to the company.


