


- Crypto Analyst Profit Blue tweets that $10K is likely the bottom and $23K-$24K the top for BTC.
- BTC forms double tops during July 2020-July 2021 indicating a bearish sentiment.
- The bulls form three parabolic curves, but the bears dismantle them.
Crypto Analyst Profit Blue tweeted that $10,000 was a likely bottom for Bitcoin (BTC) and that the range $23,000-$24,000 was a valid top. The netizen made this statement by sharing the price behavior of Bitcoin since 2017.
When considering the time frame July 2020-July 2021, of the chart shared in the tweet, it could be seen that BTC formed double tops (M-pattern), with the right shoulder reaching a slightly higher value than the left. Moreover, the neckline falls between the $30,000-$32,500 price range. Additionally, the right arm is higher than the left. The formation of double tops indicates a bearish sentiment.
Interestingly, BTC is testing $23,075 level for the second time, when the July 2022-January 2023 time frame is considered. This prompted Profit Blue to call it a valid top. Meanwhile, when considering Profit Blue’s statement from a different perspective, it is not clear as to whether he made this statement to reprimand the Bitcoin supporters who are overly optimistic with its price.
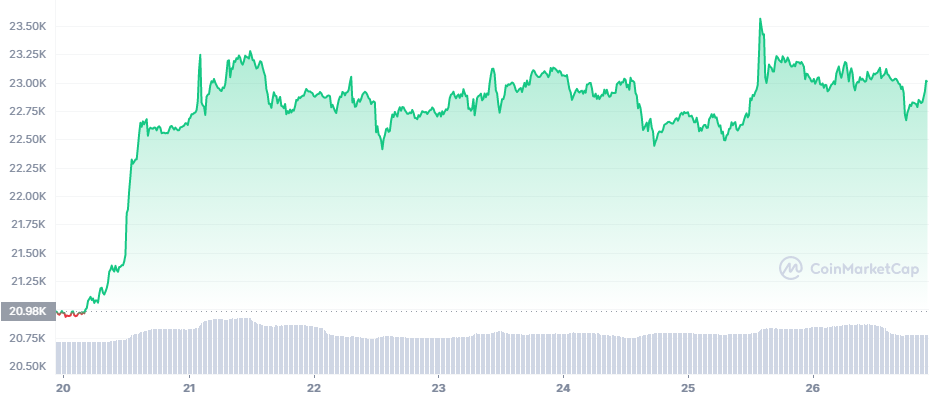
As shown in the chart above BTC opened the week with its price at $20,980. Halfway through the first day of the week, the bulls pushed BTC from $21,385 to $22,646 within a few hours. Thereafter, BTC has been fluctuating in the $22,500-$23,250 range. During the week, BTC reached its maximum price of $23,565.
Notably, although the trading volume decreased over time, BTC’s price did not increase with the reduction of supply. This depicts that the market is saturated. It could be that the sellers are holding BTC hoping for another surge and are holding.
Meanwhile, when considering the chart below, just after BTC broke out of the first parabolic curve (black) it started to form the second curve (pink). However, this did not last for long, as it dismantled out of the second curve, it tanked lower.
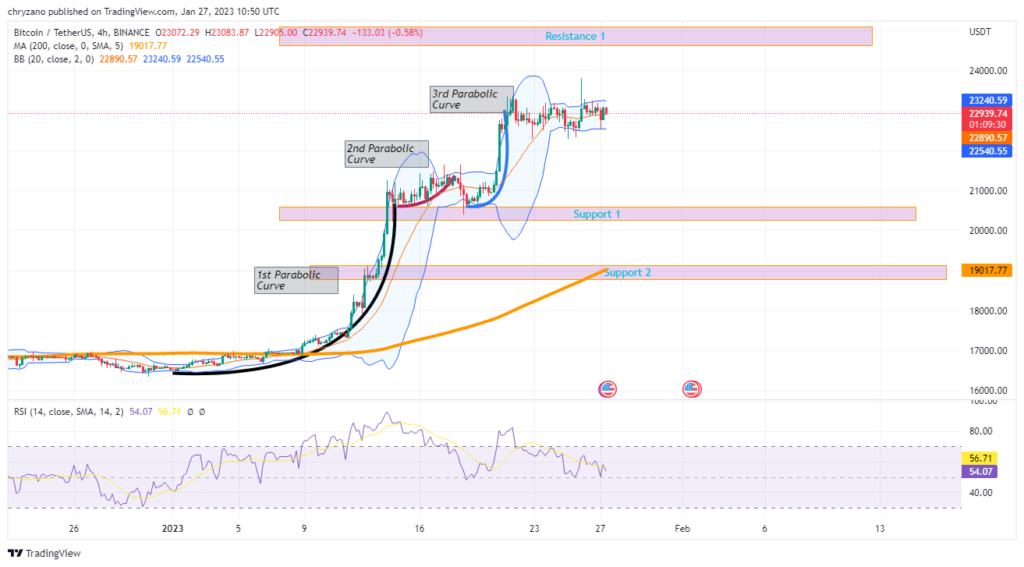
BTC bulls have been relentless and they formed the third parabolic curve (blue), however, that too came to an end as BTC touched the upper Bollinger. Notably, all the parabolic curves were dismantled after BTC touched the upper Bollinger band.
Currently BTC is moving sideways as the Bollinger band is contracting, hence, there could be less volatility. But the question that arises is: Is this the calm before the storm? Will BTC have another rally and an exponential rise?
If there’s a rally and the bulls run rampant BTC will hit resistance 1 in no time. However, if the bears control the bulls, there would be sideways movement. Contrastingly, if the bears are dominant, BTC will crash on support 1.
Disclaimer: The views and opinions, as well as all the information shared in this price analysis, are published in good faith. Readers must do their own research and due diligence. Any action taken by the reader is strictly at their own risk, Coin Edition and its affiliates will not be held liable for any direct or indirect damage or loss.
Disclaimer: The information presented in this article is for informational and educational purposes only. The article does not constitute financial advice or advice of any kind. Coin Edition is not responsible for any losses incurred as a result of the utilization of content, products, or services mentioned. Readers are advised to exercise caution before taking any action related to the company.


 Price Prediction 2026, 2027, 2028, 2029, 2030-2050")

