

- BNB at $753.07 sits above the chart’s $680–$700 support zone after the $800 rejection.
- The chart’s $748.39 midpoint and $698.56 Fibonacci level define key technical reference points.
- BNB Chain added $63.6M in tokenized stock value in seven days, reaching $1.2B.
The $800 rejection threatens the recovery structure, while BNB Chain’s tokenized stock capitalization climbs by $63.6 million weekly.
| HEADLINE PRICE | CHART REFERENCE | KEY SUPPORT | RESISTANCE |
| $674.60 | $753.07 | $680–$700 | $775–$820 |
$800 Rejection Weakens the Recovery Structure
The supplied weekly chart places BNB/USDT at $753.07, marking a 40.2% recovery from June’s $537.25 low. However, the token’s price remains 21.5% below January’s $959.52 high, indicating that the broader recovery remains incomplete.
Meanwhile, rejection near $790–$800 highlights persistent selling pressure within the $775–$820 resistance zone. The $798.21 Fibonacci level sits within this region, making a sustained breakout important for further upside.
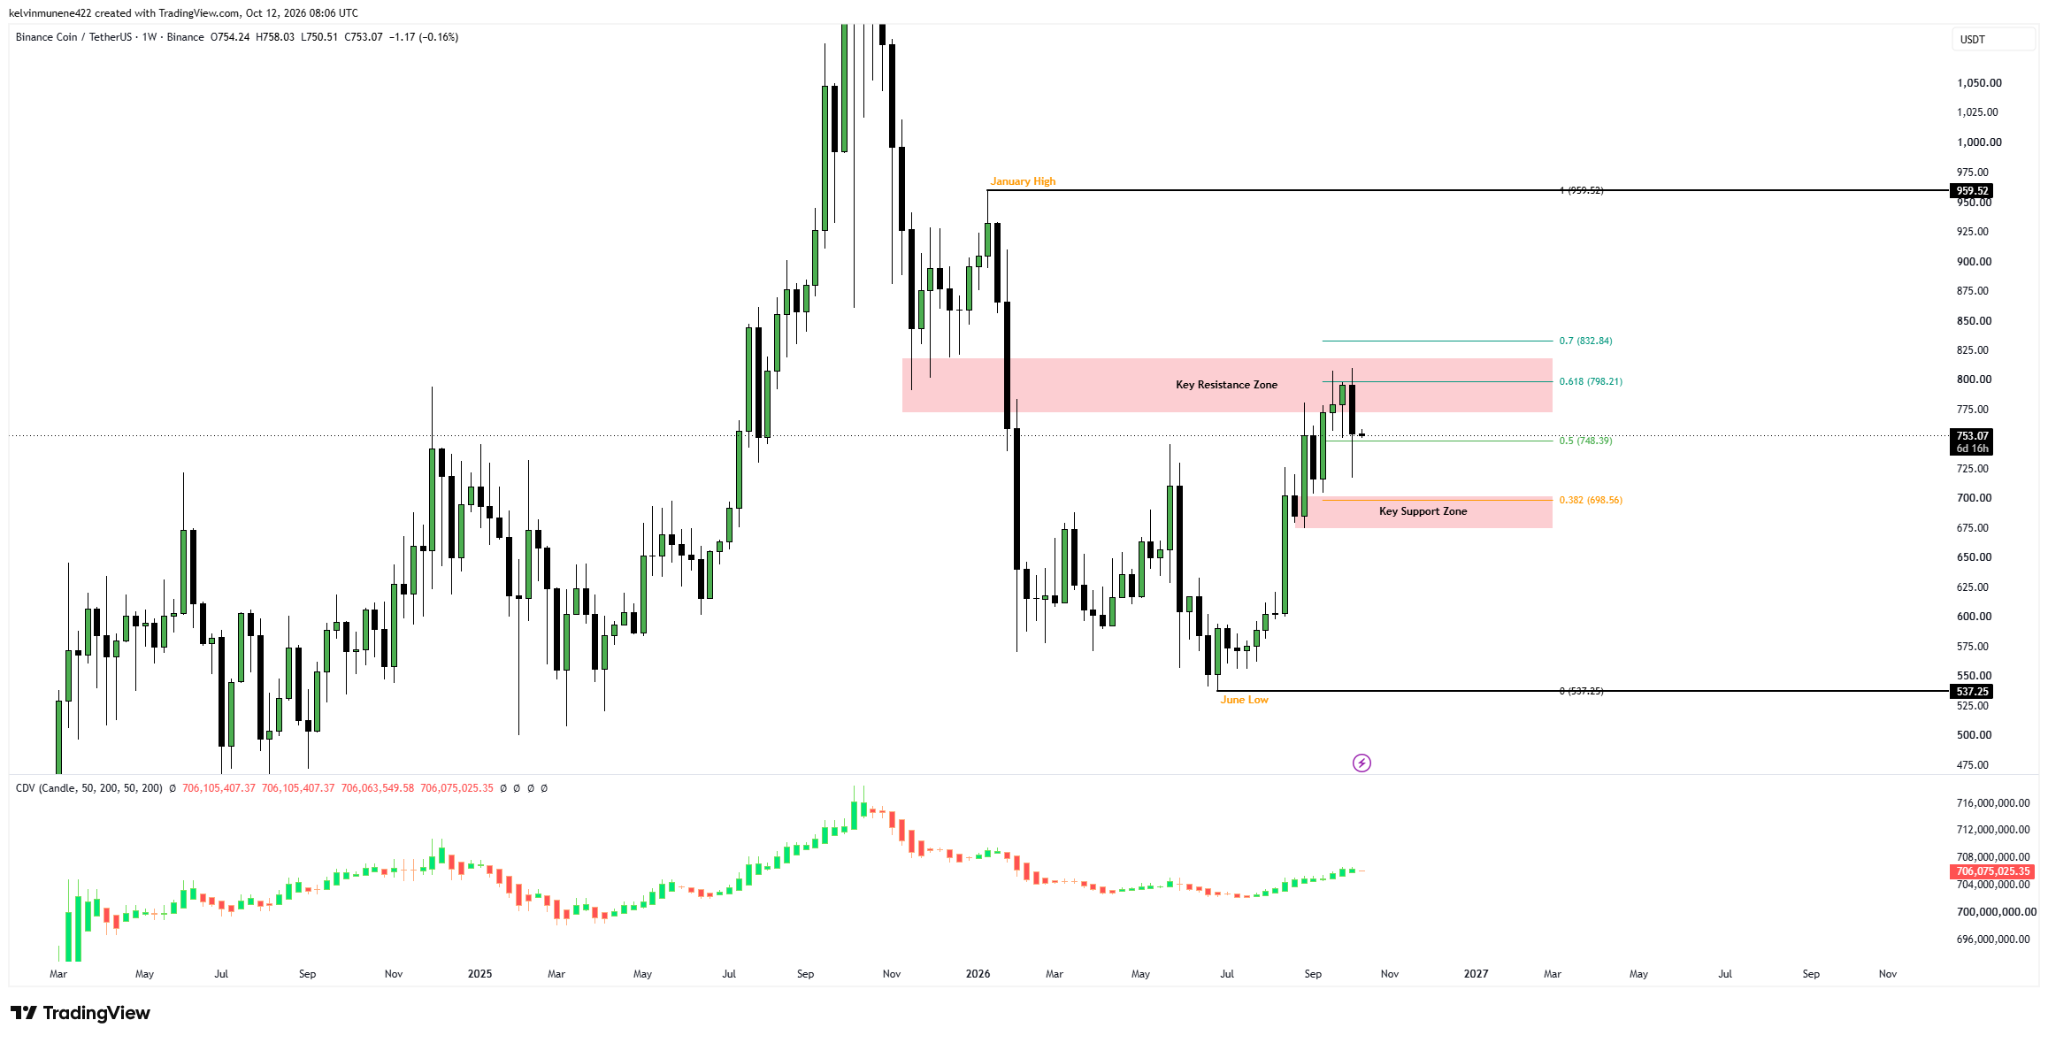
On the downside, the chart identifies $748.39 as the 50% Fibonacci midpoint and $698.56 as the 38.2% retracement level. However, the headline’s $674.60 support represents a separate technical reference.
If BNB falls toward $674.60, the $680–$700 region would become an overhead recovery barrier rather than support. Although the supplied figures do not establish the timing of the $674.60 level relative to the $753.07 chart reading, the distinction is essential when assessing the market’s technical structure.
Fibonacci Levels Define the Recovery Thresholds
From the chart reference of $753.07, a decline to $698.56 would represent approximately 7.2%, exposing a lower technical reference. Conversely, reclaiming $798.21 and breaking above the $775–$820 resistance zone would strengthen the recovery. A decisive move above $820 could then open the way toward $832.84, with $959.52 remaining as the broader upside reference.
The cumulative volume delta indicator provides additional context. It climbed toward approximately 716 million in late 2025, declined substantially through early and mid-2026, then recovered toward 706 million in recent weeks.
Although that recovery indicates improving buying-versus-selling balance under the indicator’s calculation method, CVD remains below its earlier peak. Its interpretation also depends on exchange coverage and indicator settings, making it unsuitable as standalone confirmation.
BNB Chain Expands Its Tokenized Stock Market
Meanwhile, BNB Chain is recording growth in tokenized equities. Token Terminal data shared on October 12 shows its tokenized stock market capitalization increased by $63.6 million over seven days, reaching approximately $1.2 billion.
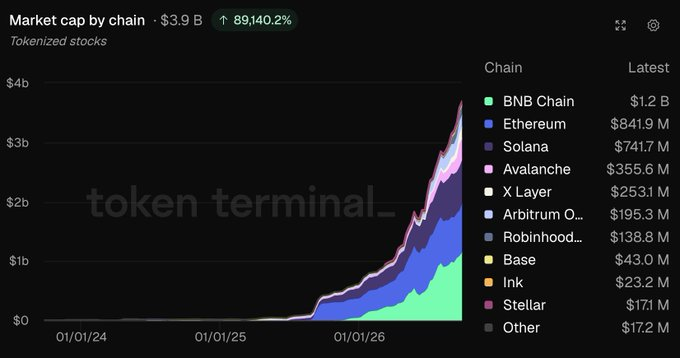
This was the largest weekly increase among tracked networks, placing BNB Chain ahead of X Layer and Ethereum. At the same time, the broader tokenized stocks and exchange-traded funds market approached $3.9 billion in capitalization.
Essentially, tokenized stocks bring traditional financial instruments onto blockchain infrastructure, expanding the real-world asset market. However, this growth does not establish a direct link to Binance Coin’s price movements.
Levels That Define the Next Move
| LEVEL | ROLE IN THE MARKET |
| $959.52 | January swing high and broader upside reference |
| $832.84 | Higher Fibonacci reference after resistance clears |
| $798.21 | Major Fibonacci resistance and recovery threshold |
| $775–$820 | Resistance zone surrounding the recent rejection |
| $748.39 | Immediate chart-based support and 0.500 Fib midpoint |
| $698.56 | Lower Fibonacci reference |
| $680–$700 | Marked support zone |
| $537.25 | June swing low and broader downside reference |
Bullish Scenario
BNB’s price reclaiming $798.21 and breaking above $820 could open the way toward $832.84, with $959.52 remaining the broader upside reference.
Bearish Scenario
However, a sustained break below $748.39 would expose $698.56 and the $680–$700 support zone. A move below $674.60 would further deepen the decline, with $537.25 marking June’s swing low.
Bottom Line
Overall, BNB’s rejection near $800 leaves the recovery facing significant resistance, while $674.60 remains a critical support level to monitor. Meanwhile, BNB Chain’s tokenized stock capitalization climbed to $1.2 billion after a $63.6 million weekly increase.
FAQs
The headline identifies $674.60 as critical support, while the chart marks $748.39 as its Fibonacci midpoint.
BNB faced resistance near $790–$800. A sustained breakout above $820 would strengthen the recovery structure.
Key levels are $698.56, $748.39, $798.21, and $832.84, with $959.52 marking January’s high.
CVD recovered toward 706 million but remains below its previous peak near 716 million, leaving buying pressure unconfirmed.
Tokenized stock capitalization increased by $63.6 million in seven days, reaching approximately $1.2 billion.
Disclaimer: The information presented in this article is for informational and educational purposes only. The article does not constitute financial advice or advice of any kind. Coin Edition is not responsible for any losses incurred as a result of the utilization of content, products, or services mentioned. Readers are advised to exercise caution before taking any action related to the company.