

- XRP price prediction stays bullish above $1.3798, with $1.4441 the level XRP needs to clear next
- XRP spot ETFs logged a 13th straight week of inflows, adding $11.31 million in the week ending October 9
- Short sellers lost $1.50 million of the $1.88 million in XRP liquidations over the past 24 hours
XRP price prediction for October 13 stays bullish above $1.3798, the level XRP needs to hold after bouncing off the rising trendline that has guided price since August.
XRP Price Analysis: Can XRP Clear $1.44?
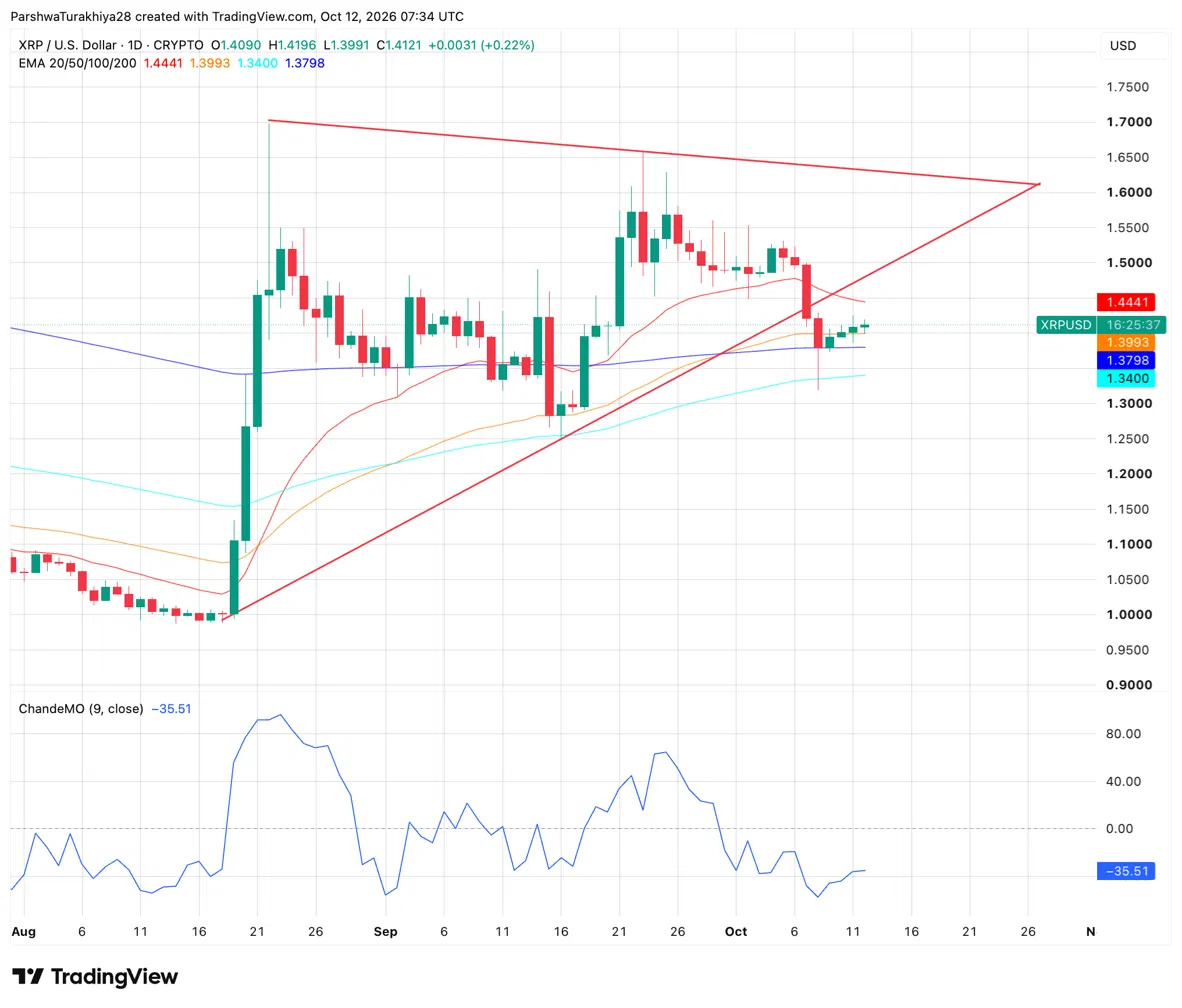
XRP trades near $1.4121, up 0.22% today, holding above a rising trendline that caught last week’s pullback and has supported price since the August low near $1.00. That trendline sits just under the 200-day EMA at $1.3798, so the zone has two reasons to act as support. Meanwhile, the 50-day EMA at $1.3993 sits close to current price.
Overhead, XRP is still below the 20-day EMA at $1.4441, the next hurdle on the way up. In addition, the upper line of the triangle, unbroken since the late-August high near $1.70, now runs toward about $1.61 by late October, so the range keeps narrowing. The Chande Momentum Oscillator reads -35.51, which is still negative, so sellers retain some influence even as price bounces.
Related: Ethereum Price Prediction: Is $5,000 ETH by December Realistic, or Is Tom Lee Too Bullish?
XRP Weekly Chart: Can XRP Hold the Keltner Channel Midline Near $1.35?
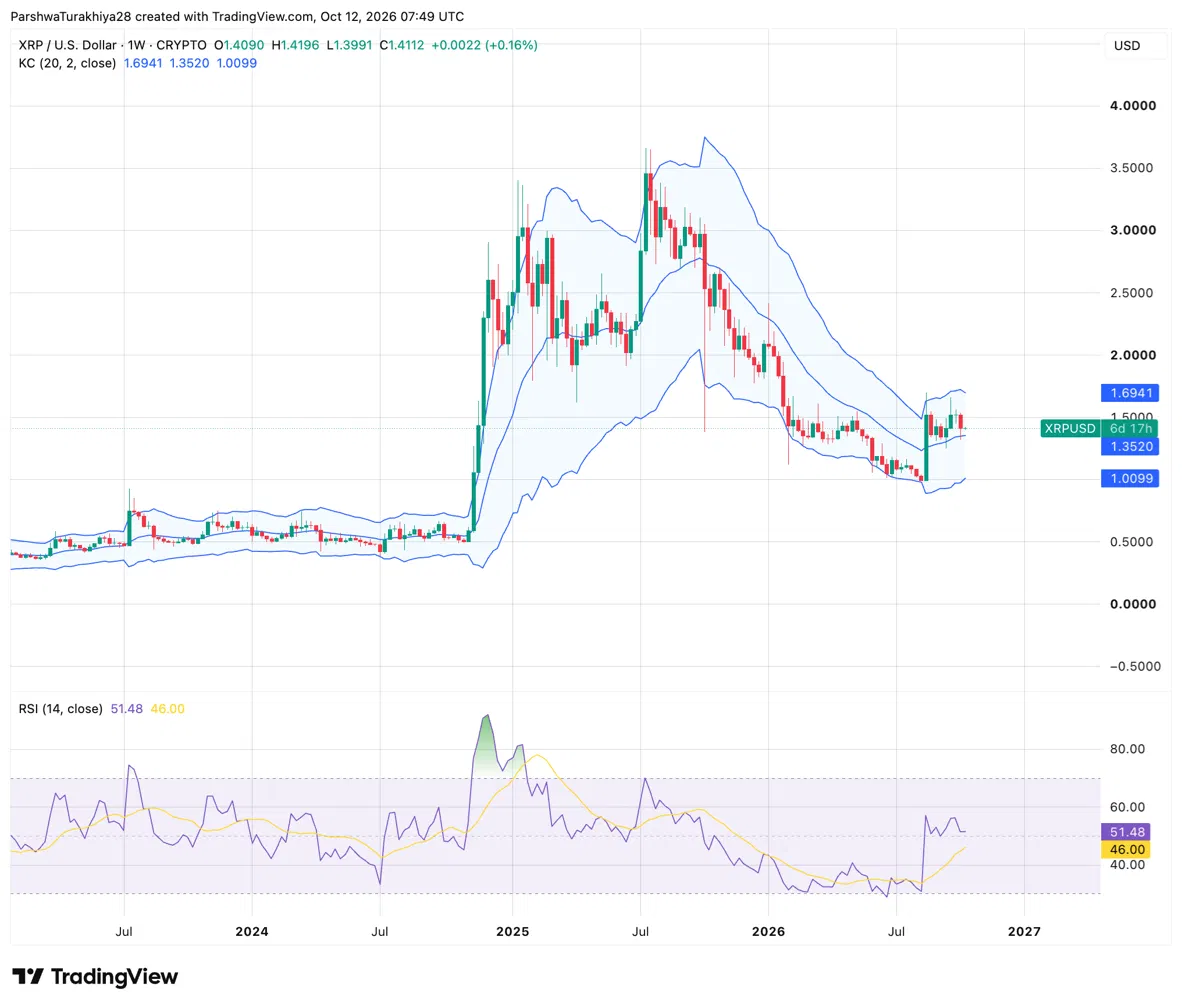
On the weekly chart, XRP trades near $1.4112, just above the midline of the Keltner Channel, a band drawn around a moving average, at $1.3520. The channel’s upper band sits at $1.6941, close to the triangle resistance near $1.61 to $1.70 on the daily chart, while its lower band sits at $1.0099.
RSI at 51.48 is just above its moving average at 46.00, both near the neutral 50 line. As a result, the weekly trend is still looking for direction after the sharp decline from earlier highs above $3.50.
XRP Support and Resistance Levels, October 13, 2026
| Type | Price |
| Resistance | $1.69 |
| Resistance | $1.61 |
| Resistance | $1.44 |
| Support | $1.40 |
| Support | $1.38 |
| Support | $1.35 |
XRP ETF Flows: A 13th Straight Week of Inflows
US spot XRP ETFs added $11.31 million in the week ending October 9, extending their inflow streak to 13 consecutive weeks according to SoSoValue.
Cumulative net inflows now stand at $1.80 billion, with total net assets at $1.57 billion. Bitwise’s XRP fund is the largest at $581.33 million in net assets, followed by Franklin’s XRPZ at $413.96 million.
XRP Derivatives: Shorts Take Most of the Losses
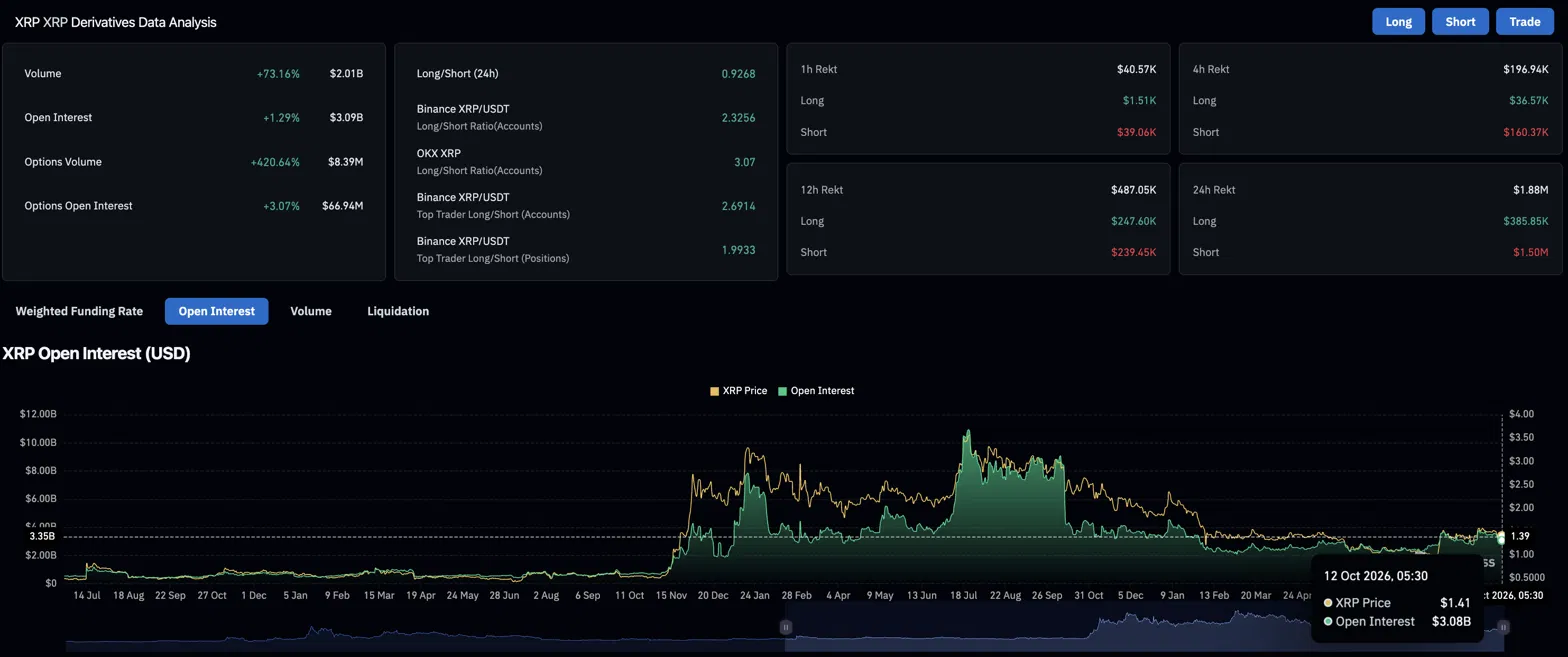
Traders betting on a falling price took most of the hit over the past 24 hours, losing $1.50 million of the $1.88 million in forced liquidations.
Trading volume jumped 73.16% to $2.01 billion, but open interest, the total value of bets still open, rose only 1.29% to $3.09 billion, so most of that extra activity looks like traders in and out of positions rather than new money entering the market.
Related: Cardano Price Prediction: ADA Bulls Target $0.27 Despite Persistent Selling Pressure
Most traders are still betting on a rise. Binance shows more than two accounts long for every one short, and OKX shows about three to one.
| Metric | Value | What it shows |
| Short liquidations (24h) | $1.50M of $1.88M | Bets against XRP took most of the losses |
| Futures volume (24h) | $2.01B, up 73.16% | Trading activity surged |
| Open interest | $3.09B, up 1.29% | Open bets rose only modestly |
| Binance long/short ratio | 2.33 | More accounts betting on a rise than a drop |
XRP Exchange Flows: Outflows Shrink to $1.09 Million
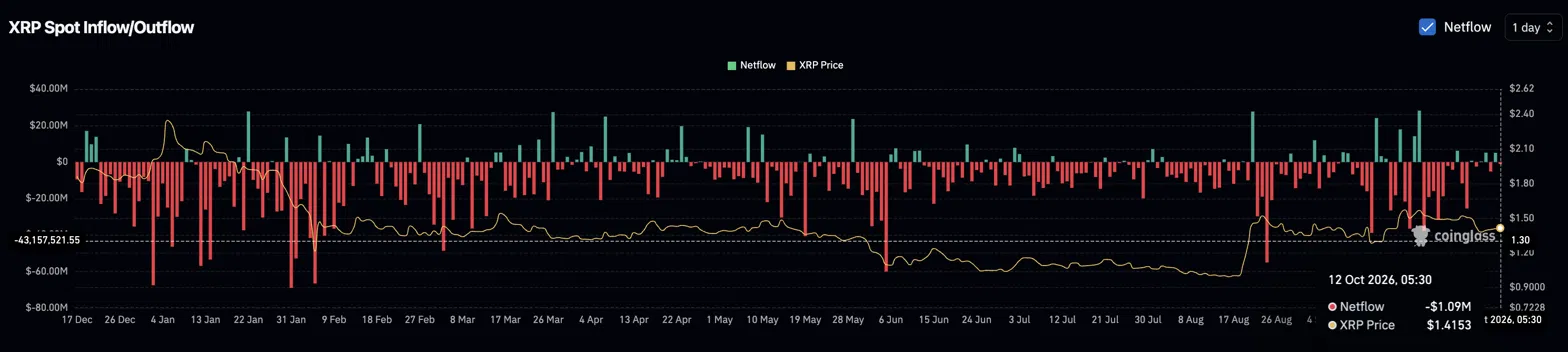
XRP’s exchange netflow showed a $1.09 million outflow as of October 12, meaning slightly more coins left exchanges than arrived, usually read as holders moving coins into storage rather than preparing to sell.
| Period | Typical Daily Netflow |
| Dec 2025 – Feb 2026 | Outflows of 40M–60M on peak days |
| Since August 2026 | Mostly under $20M in either direction |
Today’s $1.09 million outflow fits that calmer, recent pattern.
XRP Price Prediction: Bullish and Bearish Scenarios
Bullish Case, Target: $1.61
XRP holds the trendline near $1.3798 and closes a day above the 20-day EMA at $1.4441. That would put the triangle’s upper line near $1.61 in range, and continued ETF inflows would add support.
Bearish Case, Risk Level: $1.35 (Weekly Keltner Midline)
XRP loses the trendline and the 200-day EMA near $1.3798, which would put the weekly Keltner midline at $1.3520 under pressure. A close below it would then risk a deeper pullback toward the channel’s lower band near $1.0099.
Related: Bitcoin Price Prediction: Can Bitcoin Reach $87,000 as Exchange Reserves Hit a Seven-Month Low?
FAQs
XRP could climb toward $1.4441 and then $1.61 if it holds above $1.3798. On the other hand, a close below the weekly Keltner midline at $1.3520 would risk a deeper slide.
Yes. US spot XRP ETFs have logged 13 consecutive weeks of inflows, adding $11.31 million in the week ending October 9, according to SoSoValue, and cumulative inflows now stand at $1.80 billion.
Short sellers lost $1.50 million of the $1.88 million liquidated over the past 24 hours as XRP’s price pushed higher, according to Coinglass. Because open interest rose only 1.29%, the move was too small to count as a squeeze.
Only modestly. XRP’s exchange netflow showed a $1.09 million outflow as of October 12, according to Coinglass, much smaller than the $40 million to $60 million single-day outflows seen between December and February.
Disclaimer: The information presented in this article is for informational and educational purposes only. The article does not constitute financial advice or advice of any kind. Coin Edition is not responsible for any losses incurred as a result of the utilization of content, products, or services mentioned. Readers are advised to exercise caution before taking any action related to the company.