
- BONK (BONK) faces an 8% drop in 24 hours, testing support at $0.00001103 amid increasing selling pressure.
- BONK’s market cap and trading volume dropped by 7.34% and 14.55%, signalling waning investor confidence.
- Technical indicators like MACD, RSI, and Aroon suggest a bearish trend for BONK/USD in the short term.
Bonk (BONK) has been in a bearish rally over the last 24 hours, dropping from an intra-day high of $0.00001207 to a low of $0.00001103, where support was reached. This price drop is likely attributable to increasing selling pressure and profit-taking by traders.
Despite the negative trend, the support level shows there may still be some buying activity at this price point, given BONK’s 0.83% increase in the previous week. At press time, BONK was trading at $0.00001109, down 8.23% from its 24-hour high.
If this bearish trend continues, it could potentially test the next support level at $0.00001050. However, if buying pressure increases and the support level holds, BONK may have a chance to recover and retest its previous high.
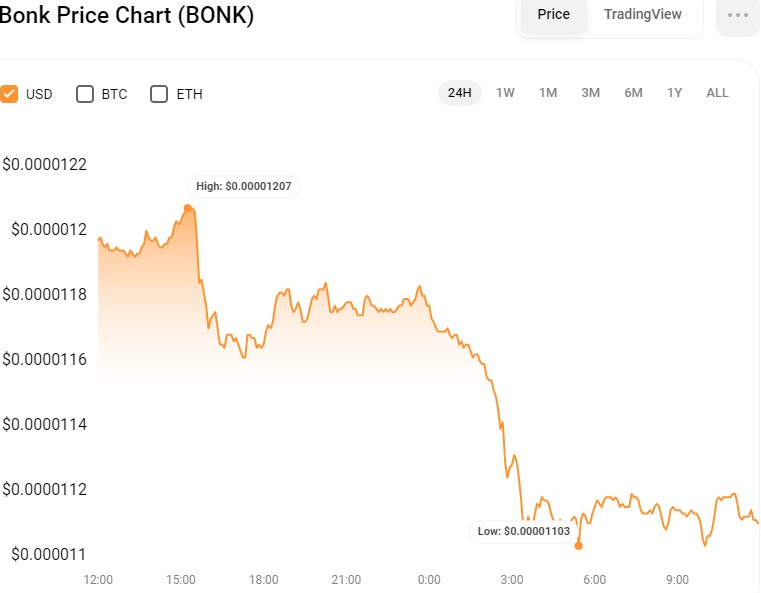
During the slump, the BONK market capitalization and 24-hour trading volume fell by 7.34% and 14.55% to $701,864,960 and $79,045,175, respectively. This decline in market capitalization and trading volume indicates a decline in investor confidence and activity in the BONK market.
BONK/USD Technical Analysis
On the BONKUSD 4-hour price chart, the Moving Average Convergence Divergence (MACD) has dropped below its signal line, with a rating of -0.000000087. This MACD trend depicts a negative pattern for BONKUSD in the short term. Furthermore, the histogram has turned negative, confirming the bearish mood and indicating additional downside potential for BONKUSD.
Supporting the bearish rally, the Relative Strength Index (RSI) dips below its signal line, with a rating of 37.41. This RSI reading implies that BONKUSD is nearing the oversold region, indicating that the price may fall lower. If the RSI goes below 30, it would confirm the negative trend and might lead to further selling pressure.
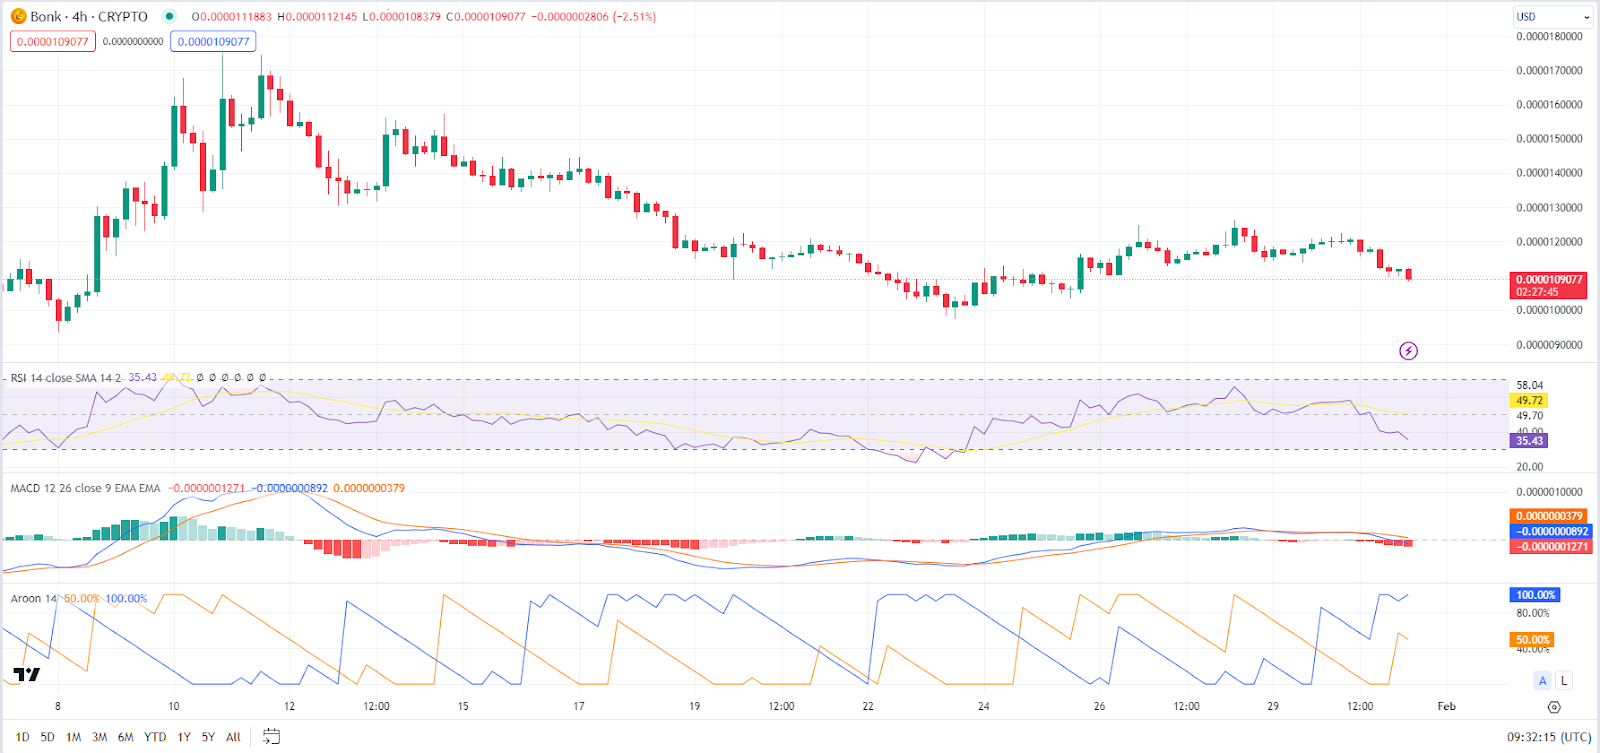
Additionally, the Aroon up (orange) has shifted below the Aroon down (blue), with the former and latter touching at 50% and 100%, respectively. This shows that momentum has shifted from bullish to bearish, with the Aroon up line representing upward price movement and the Aroon down line representing downward price movement. The convergence of these lines indicates that selling pressure is rising, which might send BONKUSD further down.
Disclaimer: The information presented in this article is for informational and educational purposes only. The article does not constitute financial advice or advice of any kind. Coin Edition is not responsible for any losses incurred as a result of the utilization of content, products, or services mentioned. Readers are advised to exercise caution before taking any action related to the company.


