


 Soars 40%: Will it Retrace or Reach New Heights?")
- BOME surges 35.71% from the recent low, hitting $0.01579 amid a buying spree.
- Market cap and volume of BOME spike 35.66% and 82.72%, signaling high investor interest.
- BOME’s technical indicators hint at potential overbought correction.
Following a period of stabilization, BOOK OF MEME (BOME) has had a bullish recovery over the last 24 hours after reaching support at $0.012. Bearish attempts to derail the uptrend were unsuccessful as a sharp rise in buying pressure drove the price over resistance at $0.015. As a result, BOME’s price rocketed to an intra-day high of $0.01681, followed by a modest drop due to profit-taking.
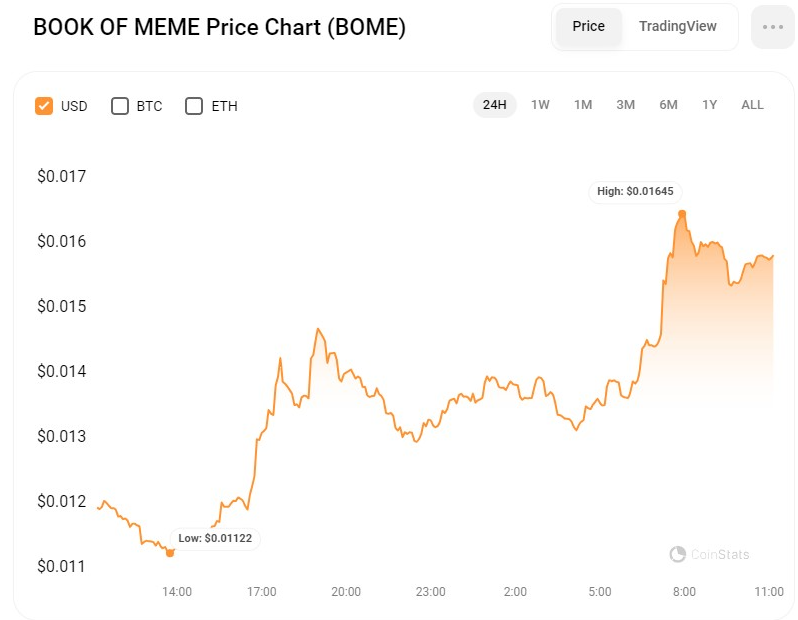
However, general market sentiment remains favorable for BOME, which continues to demonstrate resilience in its upward trend despite being 44% lower than its all-time high. At press time, BOME was trading at $0.01579, up 35.71% from its recent low, signaling substantial investor interest in the coin.
The next resistance level to monitor for BOME, according to experts, is between $0.018 and $0.023, which might be surpassed if the present positive trend continues. However, if negative momentum takes hold of the market and drives the price below $0.015, we may witness a retest of previous support levels between $0.012 and $0.01.
During the rise, BOME’s market capitalization and 24-hour trading volume increased 35.66% and 82.72%, respectively, to $871,577,445 and $1,764,030,667. This spike indicates that investors are actively investing in the market, increasing demand for BOME. The increased market capitalization and trading activity may attract greater attention from traders seeking opportunities in the coin.
BOME/USD Technical Analysis
With a value of 71.31, the Money Flow Index (MFI) on the BOMEUSD 3-hour price chart indicates that BOME is now overbought. This pattern of overbought conditions may cause a correction in the price of BOME as traders seek to capitalize on their profits.
When the MFI exceeds 70, it usually implies that the asset is overpriced and has to be corrected. As a result, traders should be cautious and consider taking gains or placing stop-loss orders to safeguard their investments.
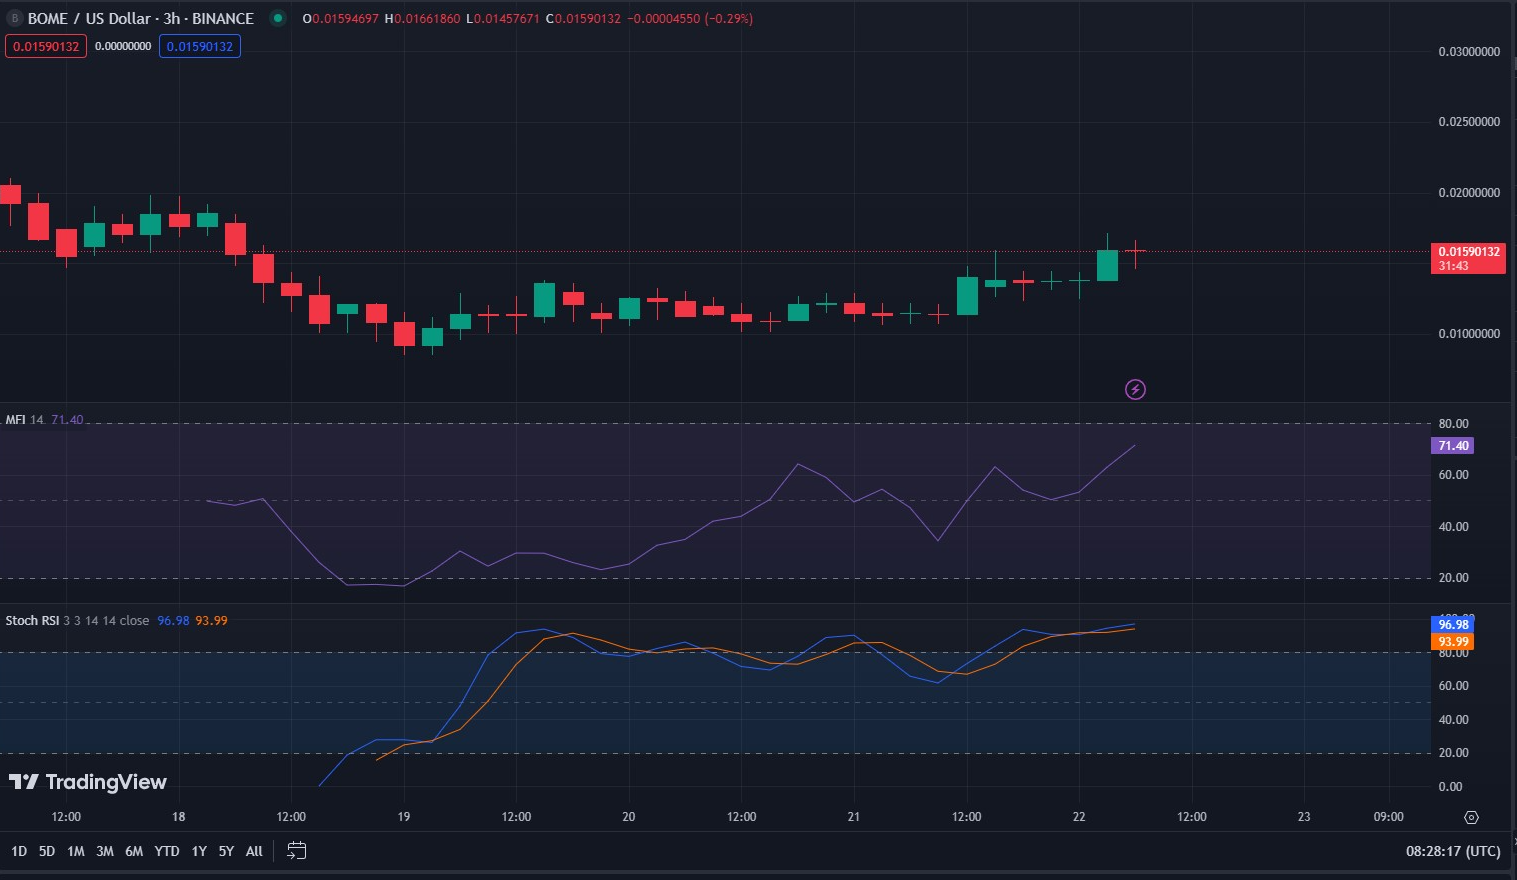
The stochastic RSI value of 97.36 confirms overbought conditions, indicating a strong possibility of a price reversal. This might provide a chance for short-term traders to profit from a decline in the price of BOME. If the stochastic RSI remains in the overbought zone, it may be prudent to wait for a more certain signal of a trend reversal before pursuing a long position in BOME/USD.
Disclaimer: The information presented in this article is for informational and educational purposes only. The article does not constitute financial advice or advice of any kind. Coin Edition is not responsible for any losses incurred as a result of the utilization of content, products, or services mentioned. Readers are advised to exercise caution before taking any action related to the company.


