


- Santiment revealed in an X post yesterday that the exchange supply for BTC and ETH has continued to drop.
- Furthermore, the intelligence firm shared that more USDT has made its way onto exchanges.
- From a technical standpoint, both ETH and BTC broke out of falling wedge patterns that had formed on their daily charts.
In an X post yesterday, the blockchain intelligence firm Santiment revealed that the exchange supplies of both Bitcoin (BTC) and Ethereum (ETH) have continued to drop. According to the post, this indicates that traders appear content with holding the 2 market leaders over the medium to long term.
Notably, the exchange supply of Tether (USDT), which is the largest stablecoin by market cap, has been increasing during the same time period. This increase in USDT’s supply on exchanges is indicative of investors and traders preparing to purchase more cryptocurrency, which may result in prices in the market increasing.
Santiment added to their post by sharing that 24.1% of USDT’s supply is currently on exchange platforms. This is the highest USDT exchange supply since March of this year. Meanwhile, 5.9% of BTC’s supply and 8.5% of ETH’s supply resides on exchange platforms.
From a price perspective, CoinMarketCap indicated that ETH outperformed BTC in terms of price performance over the past 24 hours. During this time, the leading altcoin recorded a price increase of 0.35% – boosting ETH’s price up to $1,639.42 at press time. BTC, on the other hand, suffered a 24-hour loss of 0.27%, which brought its price down to $26,554.89.
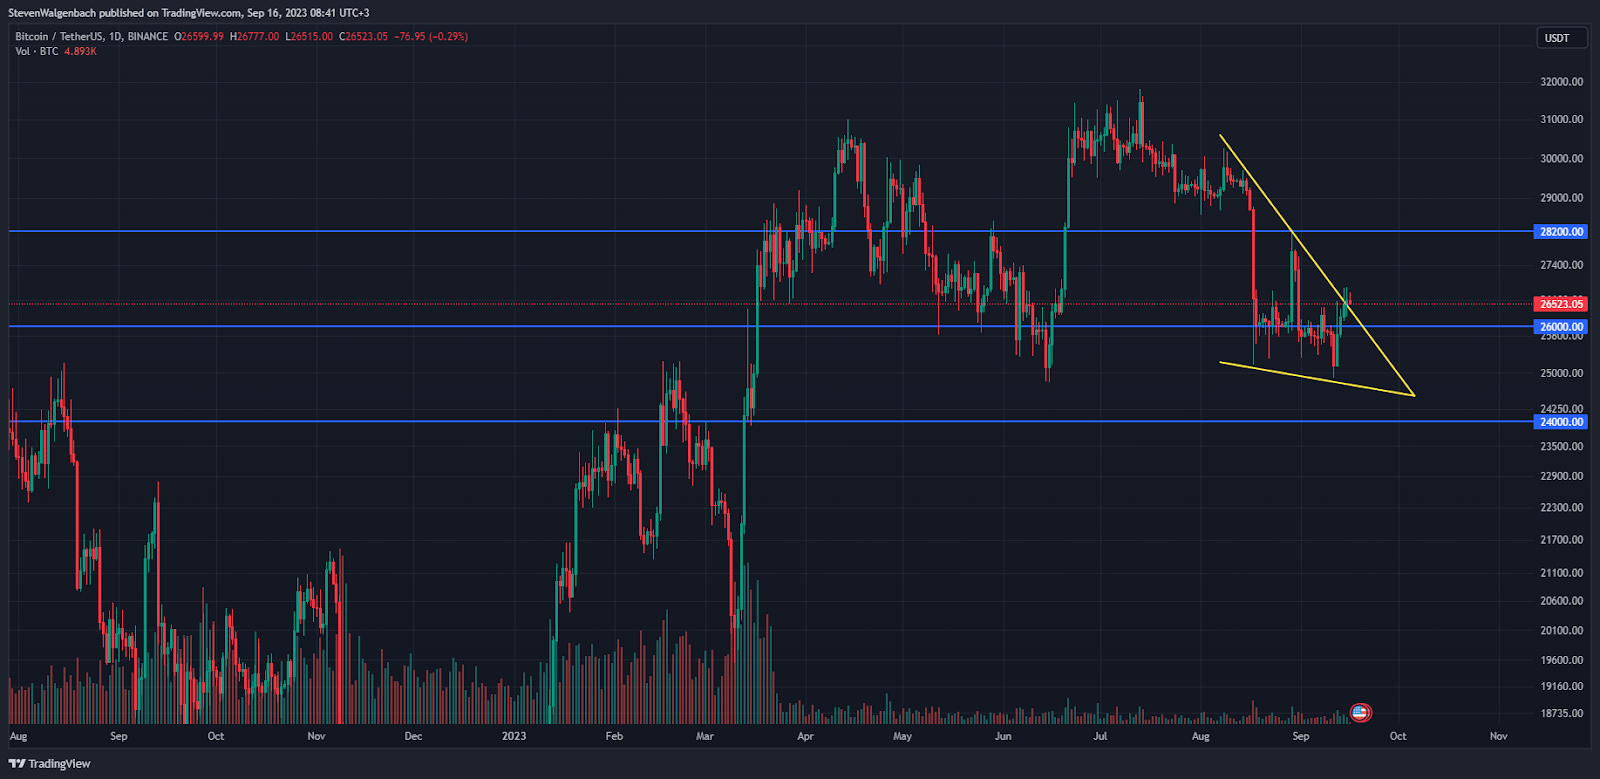
From a technical standpoint, BTC’s price had broken out of a falling wedge pattern that had formed on its daily chart throughout the past month. Furthermore, the market leader’s price continued to trade above this bullish chart pattern at press time.
If this bullishness continues, BTC’s price may attempt to challenge the next barrier at $28,200 in the upcoming week. Conversely, increased profit taking activity by traders could lead to BTC’s price dropping below the immediate support at $26K. Thereafter, continued sell pressure may push BTC’s price down to $24K.
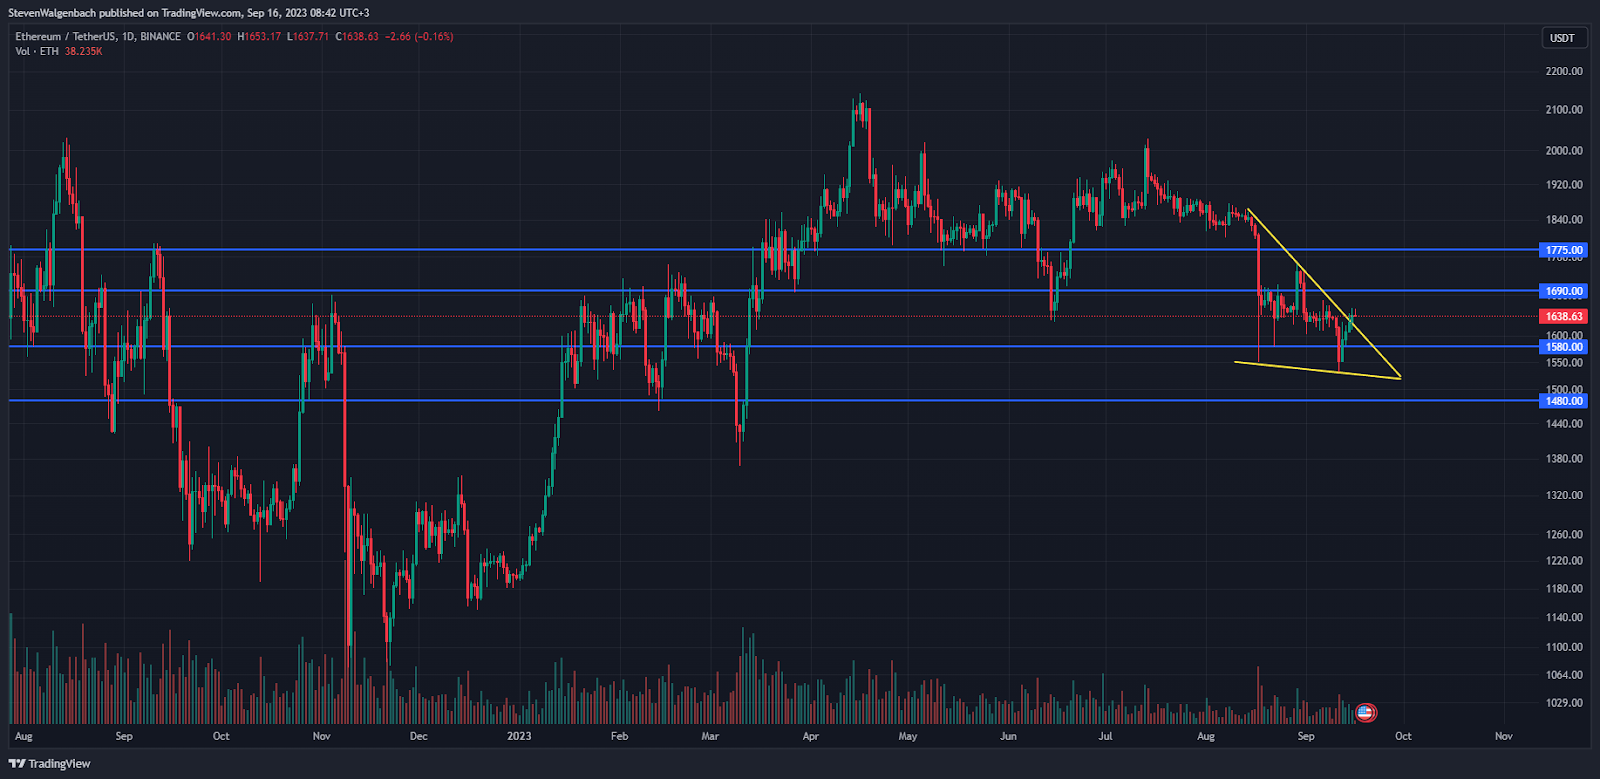
Similar to BTC, ETH’s price also broke out of a falling wedge pattern that had formed on its daily chart. Subsequently, the altcoin’s price could attempt to flip the resistance level at $1,690 into support, before potentially continuing to climb to the next threshold at $1,775.
Conversely, if ETH’s price corrects back within the falling wedge pattern, then it may be at risk of breaking below the $1,580 support level. Thereafter, a daily close below this key mark will put ETH’s price at risk of dropping to $1,480.
Disclaimer: The views and opinions, as well as all the information shared in this price analysis, are published in good faith. Readers must do their own research and due diligence. Any action taken by the reader is strictly at their own risk. Coin Edition and its affiliates will not be held liable for any direct or indirect damage or loss.
Disclaimer: The information presented in this article is for informational and educational purposes only. The article does not constitute financial advice or advice of any kind. Coin Edition is not responsible for any losses incurred as a result of the utilization of content, products, or services mentioned. Readers are advised to exercise caution before taking any action related to the company.
 Price Prediction 2026-2030: Will TRX Hit $0.50 Soon?")
 Price Prediction 2026-2050: Will HYPE Hit $100 Soon?")


: What Happens If You Use an Unlicensed Platform?")