


- An analyst named Ali predicted that BTC’s price could pump towards the end of the year if history repeats itself.
- At press time, BTC was changing hands at $29,030.40 following a 24-hour loss of 0.58%.
- A bearish chart pattern was present on BTC’s daily chart which suggested that a breakout towards the downside is imminent.
The cryptocurrency trader and analyst Ali revealed in a tweet yesterday that the price trajectory for Bitcoin (BTC) post the 2021 all-time high seems to be mirroring the 2013-2017 bullish cycle. If history repeats itself, the market leader may see its price pump towards the end of this year.
Meanwhile, at press time, CoinMarketCap indicated that BTC was trading at $29,030.40 after its price dropped 0.58% over the past 24 hours. This negative performance also pushed the cryptocurrency’s weekly performance further into the red, taking the total weekly loss to -1.12%.
Despite the negative daily performance, BTC was able to outperform the rest of the market over the past day of trading. BTC’s market dominance increased 0.02% in the last 24 hours – boosting its dominance to 48.73% at press time.
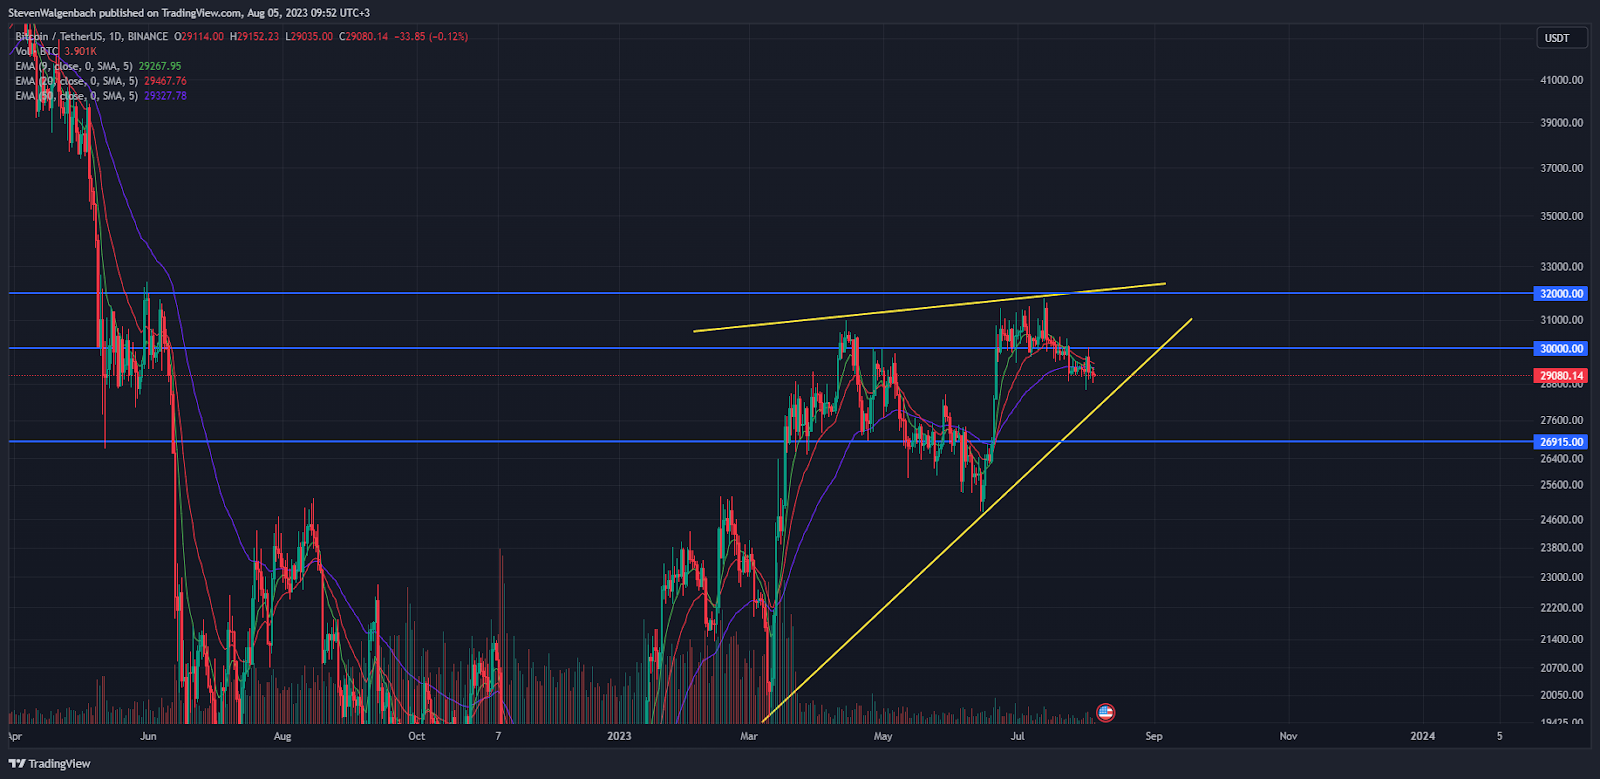
From a technical standpoint, there was a bearish rising wedge pattern that had formed on BTC’s daily chart. This pattern suggested that a breakout towards the downside is imminent in the coming week. If validated, BTC’s price could fall down to $26,915 in the following couple of days.
However, the market leader’s price may attempt to break above the psychological $30K level within the next 24-48 hours. Continued buy support may then elevate BTC’s price up to the next major resistance level at $32K.
One thing to take note of is the fact that the 9-day EMA line had crossed below the 20-day EMA line in the last week. This signaled that BTC had entered into a short-term bearish trend and its price may continue to fall in the upcoming few days. In addition to this, the 9-day EMA line had also broken below the 50-day EMA line over the past 48 hours.
If the 20-day EMA line on the market leader’s chart falls below the 50-day EMA line, then it may confirm the bearish thesis and the chart pattern will be validated. In this scenario, BTC’s price will most likely retest the crucial $26,915 support level.
Disclaimer: The views and opinions, as well as all the information shared in this price analysis, are published in good faith. Readers must do their own research and due diligence. Any action taken by the reader is strictly at their own risk. Coin Edition and its affiliates will not be held liable for any direct or indirect damage or loss.
Disclaimer: The information presented in this article is for informational and educational purposes only. The article does not constitute financial advice or advice of any kind. Coin Edition is not responsible for any losses incurred as a result of the utilization of content, products, or services mentioned. Readers are advised to exercise caution before taking any action related to the company.


 Price Prediction 2026, 2027, 2028, 2029, 2030-2050")

