


- The BTC/USD pair might drop to $41,747 due to the lack of aggressive buyers.
- ETH‘s price could run beyond $3,000 if accumulation returns.
- XRP’s momentum was weak, indicating a downward move to $0.55.
According to Santiment, Bitcoin (BTC), Ethereum (ETH), and Ripple (XRP) have hit historic high-risk profit levels. The post revealed that Bitcoin’s profit level was 83%, Ethereum was 84%, and XRP was 81%. Furthermore, the post noted that previous high-risk profit levels were between 55% and 75%. So, it is likely that the prices of these cryptocurrencies risk a continuous fall from here.
However, the crypto analysis platform admitted that external influences like the ETF might lead to a price increase. But still, investors with a long-term horizon should watch out if the profit levels drop below 75%.
Bitcoin (BTC)
BTC’s rise to $49,000 after the U.S. SEC approved the spot ETFs was short-lived. At press time, bears have turned out to be more powerful than bulls. From the 4-hour chart, BTC closed below the 50 EMA (yellow), which was at $43,400. However, the coin rose above the 20 EMA (blue), which was positioned at $42,842.
This trend is considered bearish, suggesting that bulls are not as aggressive as bears. If BTC does not break the resistance at $43,074, selling pressure could accelerate. Should this be the case, the BTC/USD pair could drop to $41,747.
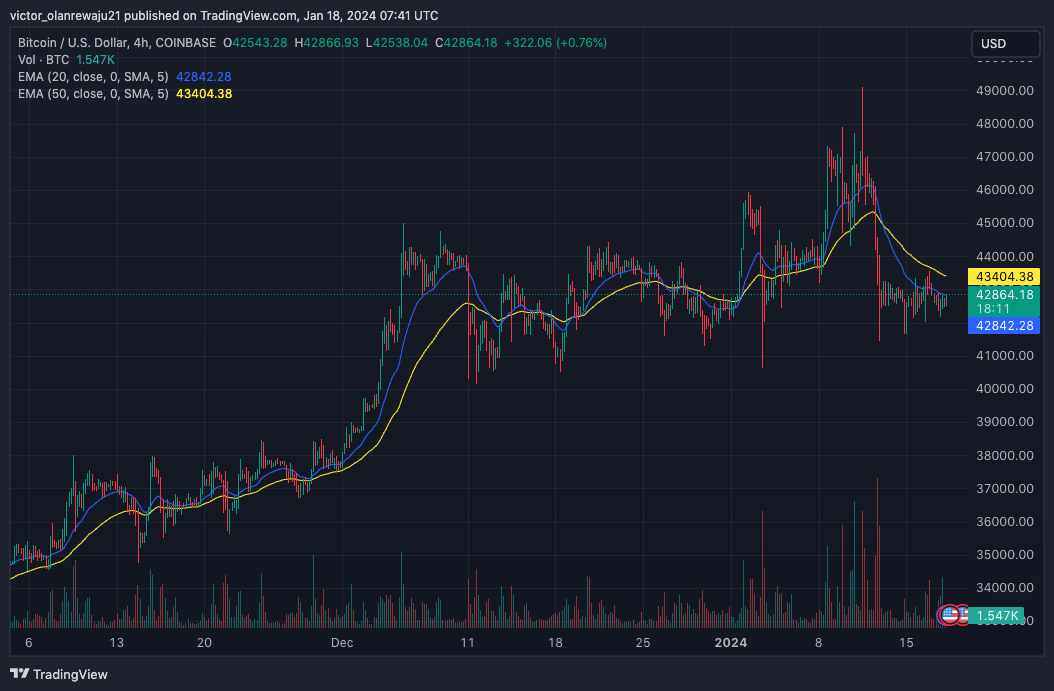
However, if the price rebounds, a move back to $45,000 could be possible. But that looks unlikely because buying pressure was absent as of this writing.
Ether (ETH)
The optimism around an upcoming ETH ETF helped the price rise to $2,700 on January 12. The performance has also helped the altcoin topple Bitcoin’s dominance over the past week. According to the Accumulation/Distribution (A/D) indicator, bulls bought a lot of ETH between January 10 and 12. However, that buying momentum has slowed down and caused the price to stall.
Furthermore, indications from the Auto Fibonacci extension showed that ETH’s correction might stop once it hits $2,498. This was where the 0.236 Fib level was.
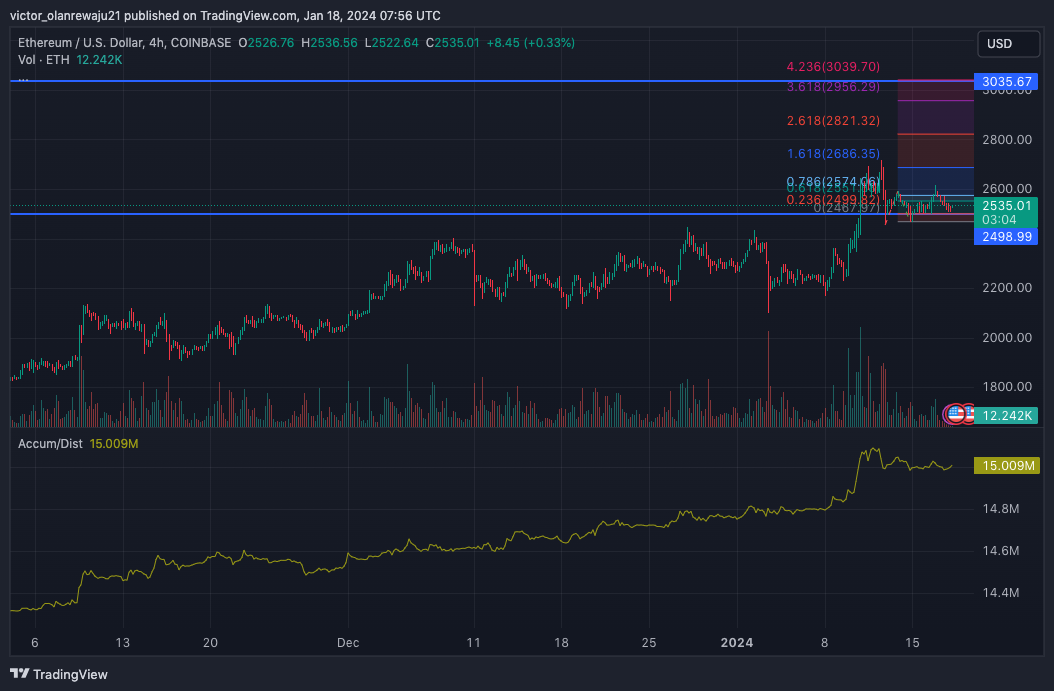
Also, if accumulation returned as it did between January 10 and 12, the price might rally to $3,035 where the 4.236 Fib level was positioned.
Ripple (XRP)
The price of XRP has dropped by 4.84% in the last seven days. Like its price action, the trading volume had also decreased, indicating that a notable move was unlikely in the short term.
At press time, the RSI was down to 43.17, indicating weak bullish momentum. Also, the RSI formed a negative divergence. This confirmed that it could be difficult for XRP to rise above $0.56. In a highly bullish case, the token might rise to $0.58. However, the likely move for XRP could be run down to $0.55, which seemed like a considerable support level.
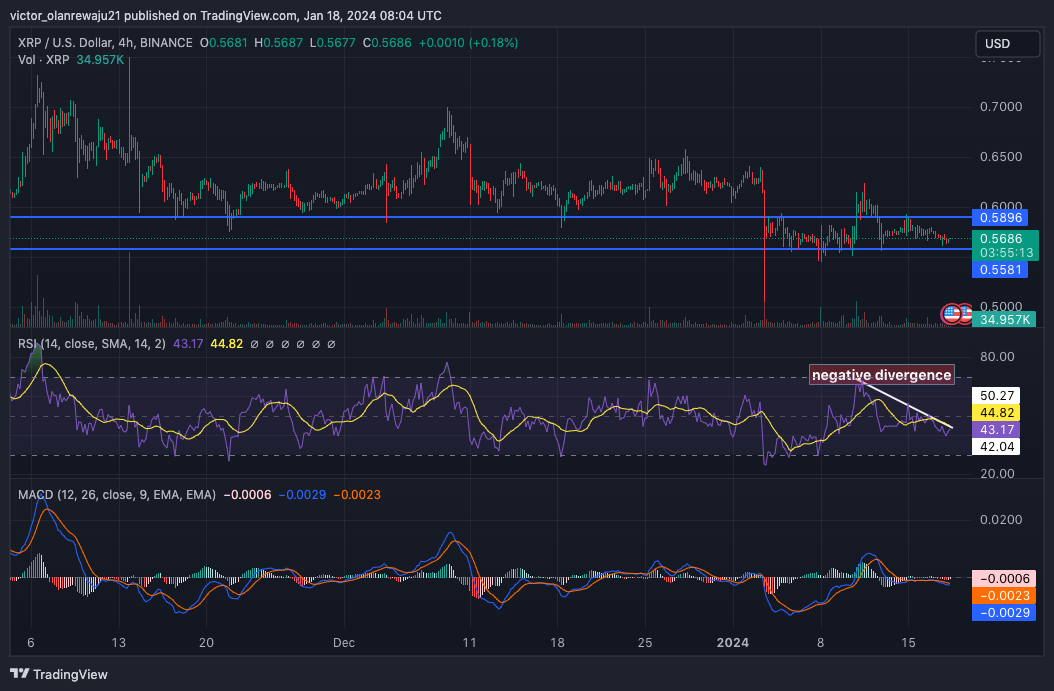
The MACD also aligned with the RSI indications, as it was negative. This suggests that XRP could linger around bearish momentum for a while before any substantial revival.
Disclaimer: The information presented in this article is for informational and educational purposes only. The article does not constitute financial advice or advice of any kind. Coin Edition is not responsible for any losses incurred as a result of the utilization of content, products, or services mentioned. Readers are advised to exercise caution before taking any action related to the company.


