


- BTT faces resistance at $0.00000132, dropping over 10%, but rising trading volume suggests a potential for a turnaround.
- Indicators like RSI and MACD hint at further BTT price declines, urging caution for investors.
- CMF positivity offers hope amid the bearish trend, indicating potential support for BTT’s price recovery.
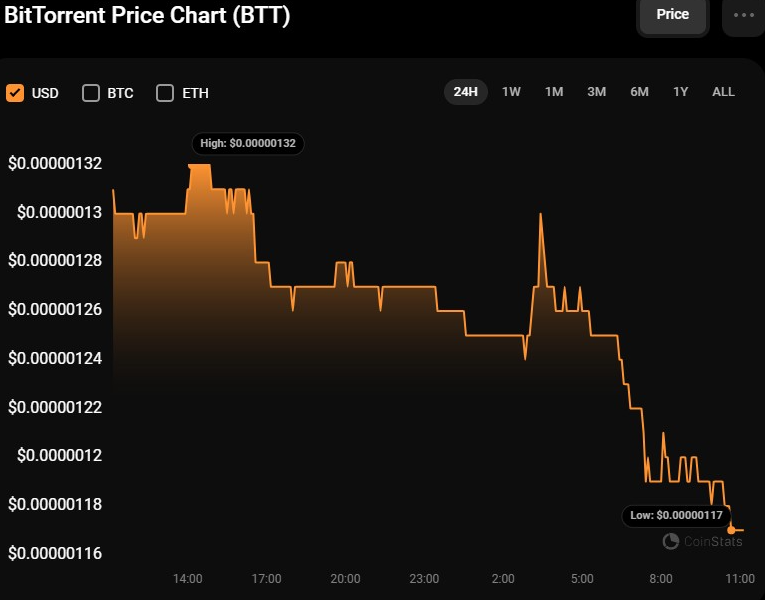
BitTorrent (BTT) has been in a downtrend for the previous 24 hours, with a bullish effort to reverse the trend, meeting resistance at the intra-day high of $0.00000132. As a result, BTT has fallen below its support level of $0.00000120, plummeting more than 10% as of press time.
This drop in value might be related to market volatility and profit-taking by traders following BitTorrent’s (BTT) spike in value earlier in the week, which may have encouraged some traders to take profits.
According to CoinStats, BTT’s market capitalization fell by 10.07% to $1,110,421,267 during the decline, while its 24-hour trading volume increased by 14.80% to $82,531,484. The drop in the value of BTT and the fall in market capitalization might be attributed to resistance encountered at the intra-day high, leading traders to take gains and contribute to the present drop.
Despite this, BTT’s 24-hour trading volume has increased, showing continuous interest and activity in the market as traders take advantage of the cheaper price. This higher trading activity shows that some investors may view the drop as a buying opportunity, resulting in a potential BTT value turnaround.
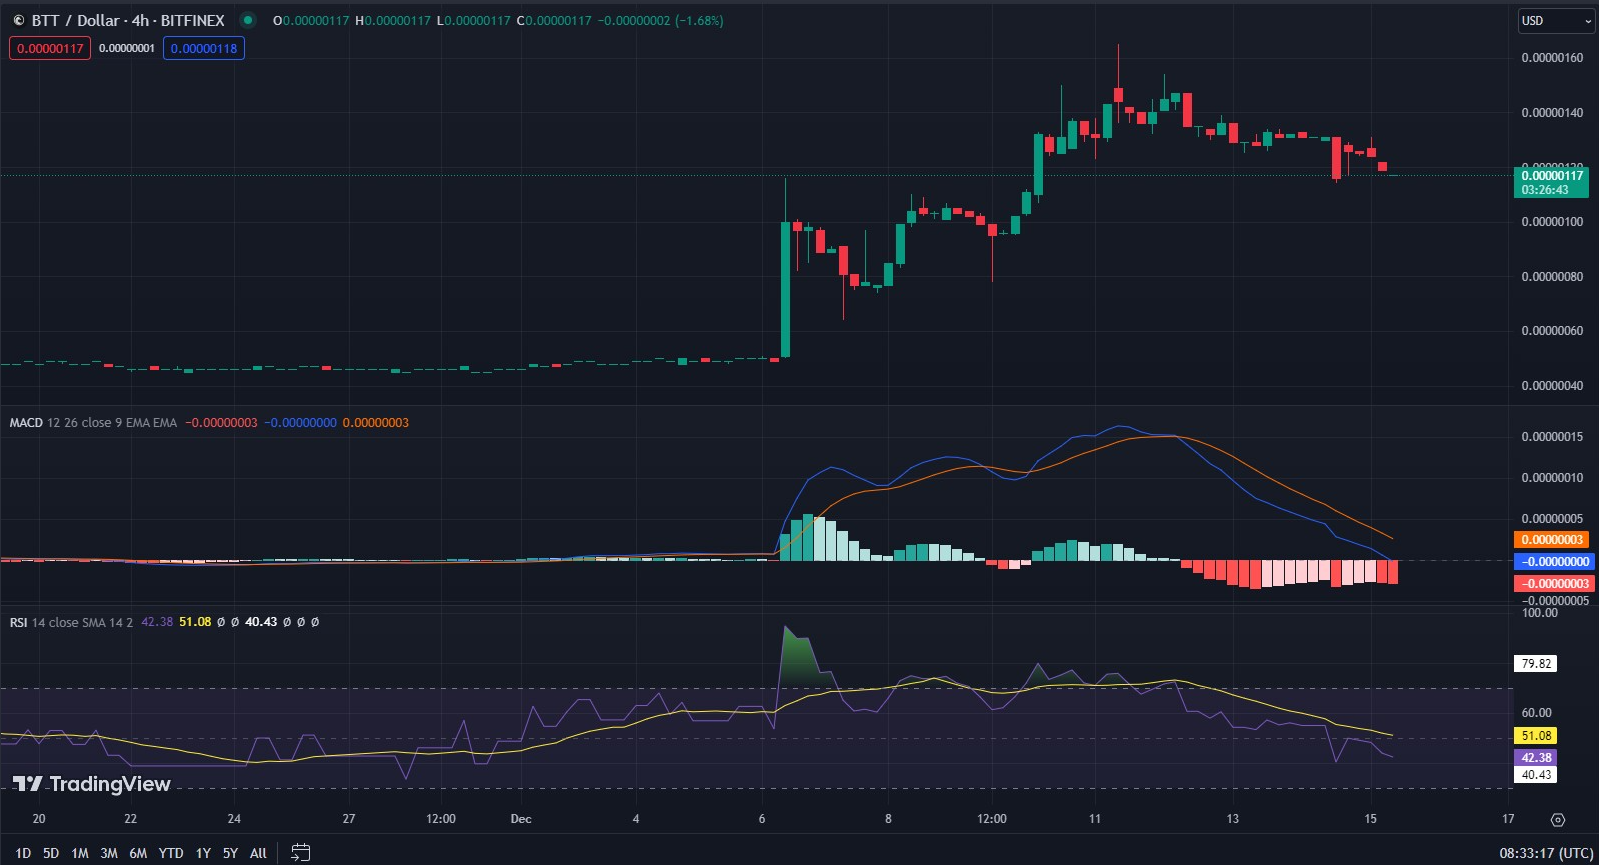
The Relative Strength Index (RSI) on the BTTUSD 4-hour price chart is falling, with a reading of 42.38. This RSI implies that BTT may still have more to fall before hitting oversold territory. If the RSI continues to decline and falls below 30, it may imply that BTT is oversold and is due for a price trend reversal.
Furthermore, the MACD (Moving Average Convergence Divergence) indicator displays negative signs, with the MACD line crossing below the signal line. This lends credence to the probability of additional decline in the value of BTT. In addition, the MACD rating of -0.01 shows that sell pressure is building and that further negative movement is possible. Additionally, the MACD histogram displays a negative trend, indicating that the selling momentum is intensifying.
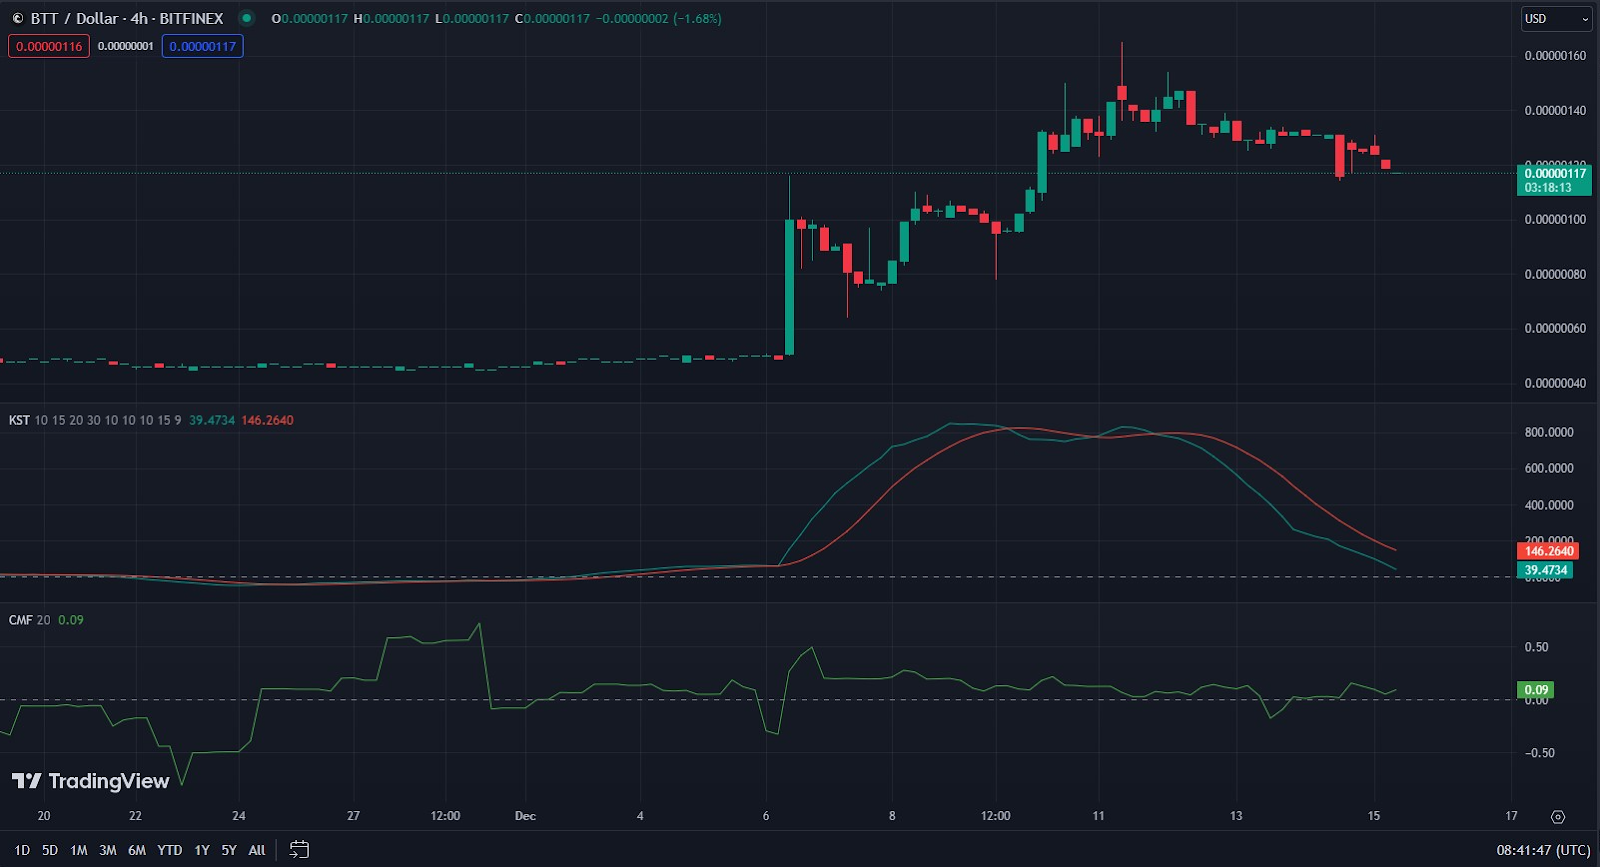
BTT’s Know Sure Thing (KST) indicator indicates a negative trend. With a rating of 39.4734, the KST line has crossed below the signal line, signalling a probable slowdown in momentum and more negative risk for BTT. This trend warns investors to be cautious and consider selling their BTT holdings, as the combination of negative signals from both the MACD and the KST indicators indicates a significant likelihood of additional price declines in BTT.
The Chaikin Money Flow (CMF) trend, with a rating of 0.009, shows that there may still be some purchasing pressure in the market for BTT. This trend may restrict the degree of BTT’s price decline and offer a chance for a comeback. If the CMF rating remains positive or increases, buyers are still active in the market and may support BTT’s price reversal.
In conclusion, BitTorrent (BTT) faces bearish indicators, but increased trading activity and CMF suggest a potential rebound amidst the current downturn.
Disclaimer: The information presented in this article is for informational and educational purposes only. The article does not constitute financial advice or advice of any kind. Coin Edition is not responsible for any losses incurred as a result of the utilization of content, products, or services mentioned. Readers are advised to exercise caution before taking any action related to the company.


