


- Unyielding buying pressure from SOL bulls drives the price up by nearly 7%.
- According to recent analysis, the SOL market has been trending upward in the previous 24 hours.
- If bull strength persists, indicators point to more gains in the near future.
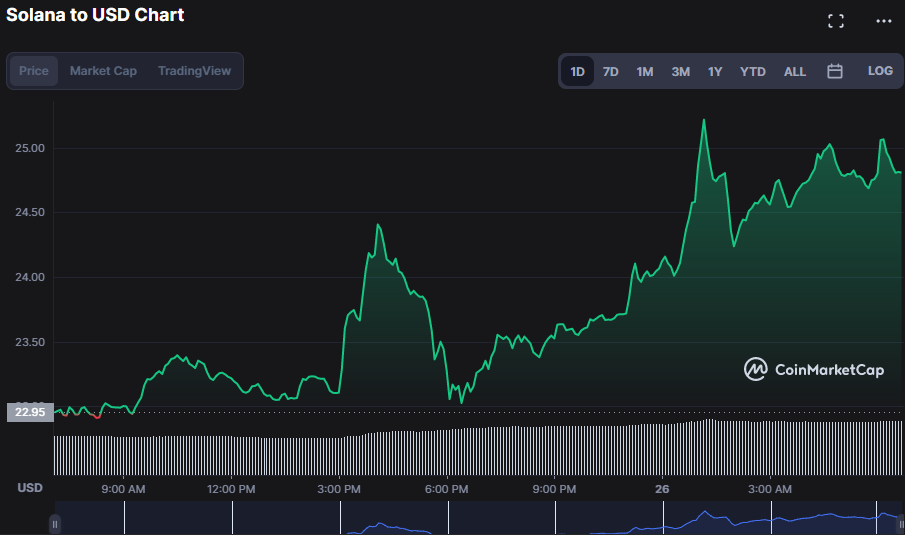
Over the previous 24 hours, the Solana (SOL) market has been bullish, with prices reaching a high of $25.22 before hitting resistance. As a consequence, bulls in SOL were able to value the price over yesterday’s close of $24.57 at the time of writing, with the price rising 7.81% to $24.81.
During the upturn, both market capitalization and 24-hour trading volume surged by 7.87% to $9,185,213,809 and 41.20% to $1,175,517,389, reflecting the confidence in SOL price gains.
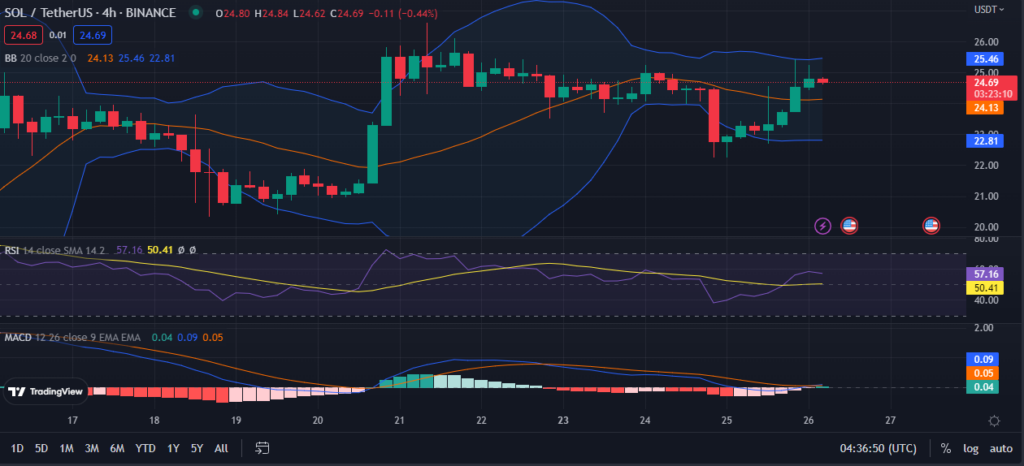
Due to the increasing market volatility, the Bollinger bands are widening with the upper band at $25.46 and the lower band at $22.80, indicating a positive trend. This movement is clearly visible on the SOL 4-hour price chart, implying that as market confidence rises, significant price gain is expected to be sustained. This viewpoint is supported by SOL price moves towards the higher Bollinger band, reflecting the sustained bull dominance.
Due to the fact that the RSI is at 57.50, neither in the overbought nor oversold area, the bulls are likely to maintain their domination for the time being. Bullish hopes for even more of a rise are bolstered by the RSI’s upward movement, which indicates that purchasing pressure is rising.
With a value of 0.09, the MACD has crossed above the signal line, indicating that buyers have the upper hand. This uptick is further supported by the histogram’s position in the positive range, lending traders optimism for a longer bull run.
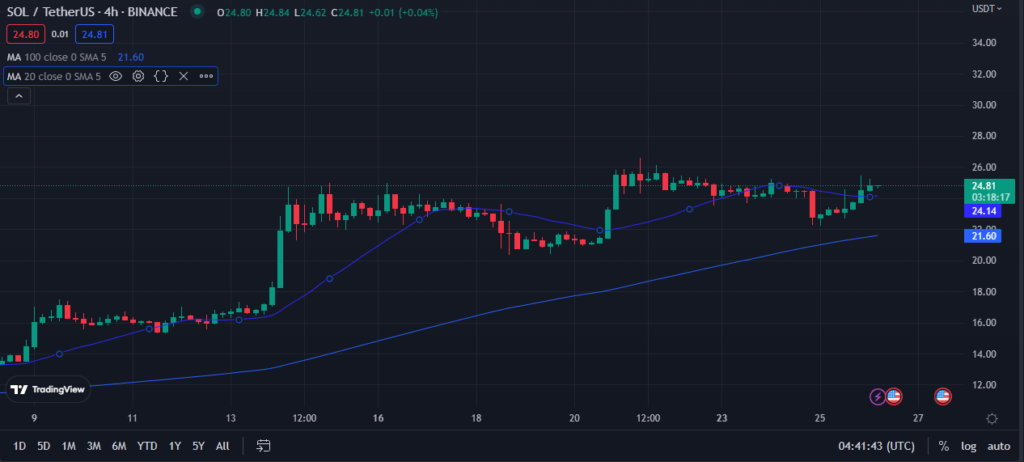
A golden cross (bullish crossover) is generated when the short-term MA crosses above the longer-term MA. This is reflected in the SOL price chart, where the 20-day MA is at $24.14 and the 100-day MA is at $21.60. This move foreshadows a further bull run, and it is supported by the green engulfing candlestick, which reflects enhanced bull power hence projecting further SOL price gain in the near term.
If SOL’s steady ascent is to continue, bulls need to keep pushing prices over their current resistance level.
Disclaimer: The views and opinions, as well as all the information shared in this price analysis, are published in good faith. Readers must do their own research and due diligence. Any action taken by the reader is strictly at their own risk, Coin Edition and its affiliates will not be held liable for any direct or indirect damage or loss.
Disclaimer: The information presented in this article is for informational and educational purposes only. The article does not constitute financial advice or advice of any kind. Coin Edition is not responsible for any losses incurred as a result of the utilization of content, products, or services mentioned. Readers are advised to exercise caution before taking any action related to the company.

: What Happens If You Use an Unlicensed Platform?")


