


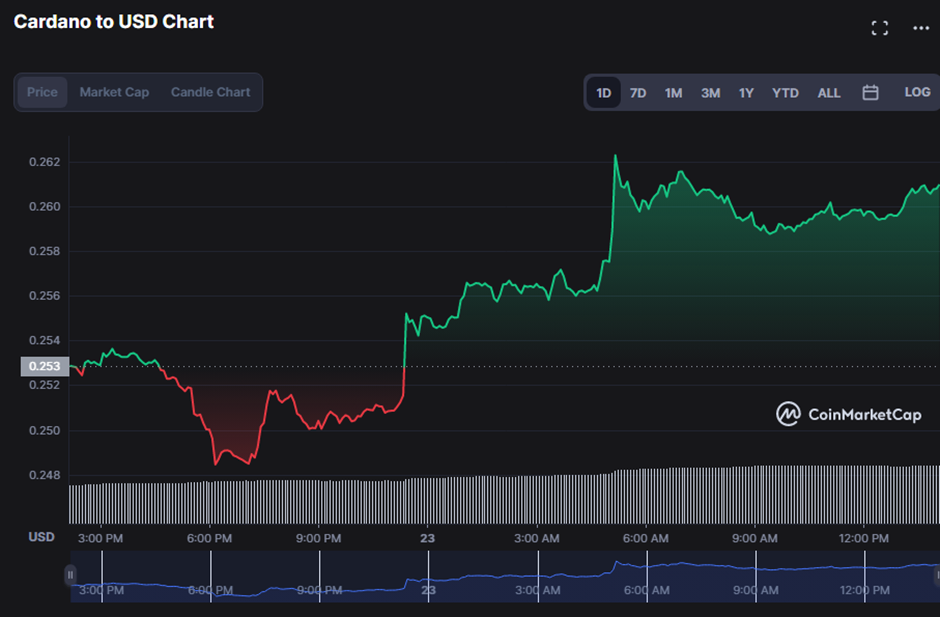
- Cardano (ADA) has been on a rising trend in the last 24 hours, according to recent statistics.
- ADA prices are facing resistance at $0.2623, their intraday high.
- Technical indicators hint that the bull run may continue if bulls hold the resistance level.
After experiencing a minor downturn during the day, bulls in Cardano (ADA) were able to revert the negative momentum after finding support at $0.2482. This bullish dominance steadily lifted the price until it met resistance at the intra-day high of $0.2623.
Cardano (ADA) price was $0.2594 as of press time, representing a 2.72% increment.
This upward trend was followed by increases in market capitalization and 24-hour trading volume of 2.70% and 51.33%, respectively, to $8,951,124,534 and $211,646,816.
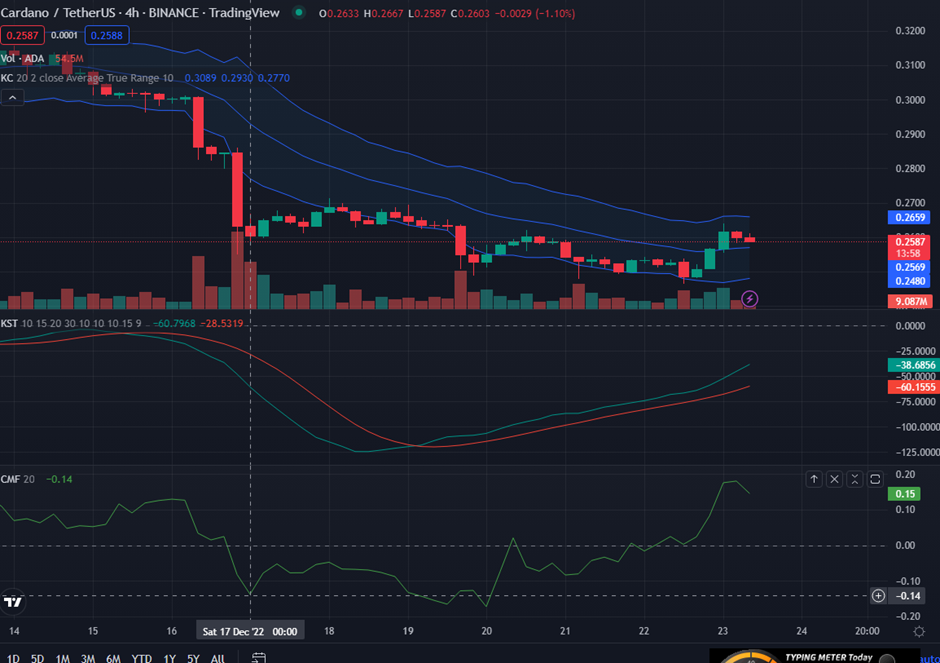
As the Keltner bands broaden and point upwards, with the upper band touching at 0.2659 and the lower band touching at 0.2480, this bullish dominance in ADA is expected to remain until bulls power runs out. As the price action moves toward the upper band this notion of a persistent bull run is backed.
The movement of the Know Sure Thing (KST) indicator, on the other hand, concerns investors because it is in the negative region, with a reading of -38.6521. This negative trend is mitigated by the fact that it is above its SMA line, indicating that bulls still have the upper hand.
Further bullish trend is expected to dominate the market as the Chaikin Money Flow (CMF) moves in the positive region. This is demonstrated by a reading of 0.15, but its pointing south warns traders of a probable reversal if the CMF line crosses into the negative sector.
A bullish crossover (Aroon up above Aroon down) is visible on the Aroon indicator, with the line touching 85.71% and 64.26%, respectively. This movement indicates that bull power is still strong, providing hope for a lengthy bull run in the ADA market.
The stochastic RSI is in the overbought region and below its SMA line with a value of 92.18, indicating that the bull run is coming to an end. This, however, serves as a warning to traders to keep a lookout for a possible reversal in the near future if bulls do not battle on.
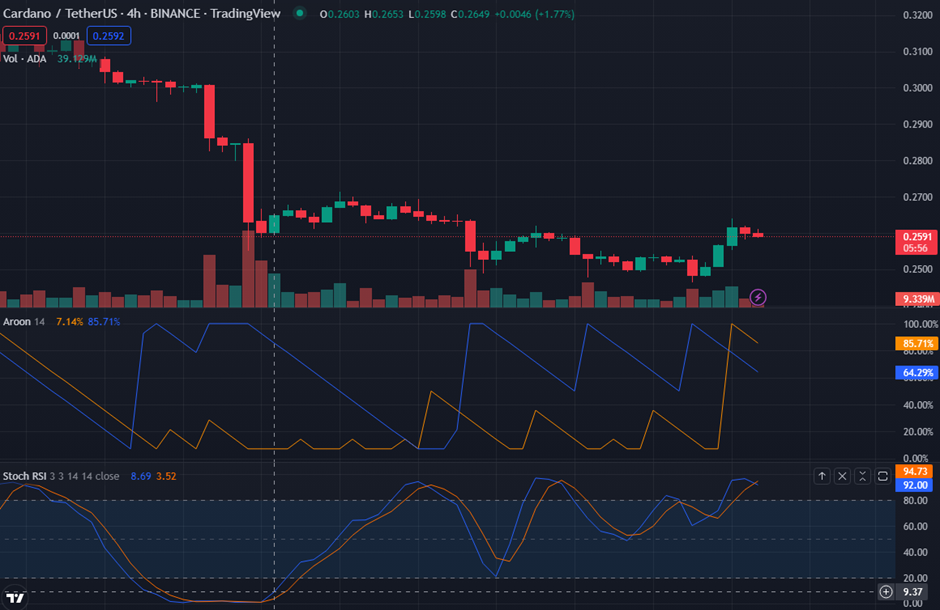
If the bulls can hold the barrier level, ADA prices may be able to break through the resistance level.
Disclaimer: The views and opinions, as well as all the information shared in this price analysis, are published in good faith. Readers must do their own research and due diligence. Any action taken by the reader is strictly at their own risk. Coin Edition and its affiliates will not be held liable for any direct or indirect damage or loss.
Disclaimer: The information presented in this article is for informational and educational purposes only. The article does not constitute financial advice or advice of any kind. Coin Edition is not responsible for any losses incurred as a result of the utilization of content, products, or services mentioned. Readers are advised to exercise caution before taking any action related to the company.


