


- HNT bears take charge to reverse the market trend.
- A bearish momentum has been dominant for the coin in the past 24 hours.
- The four-hour chart indicates bears have started biting.
Helium (HNT) has been among the top cryptocurrency that have experienced a drastic fall in the past one day. HNT has achieved a 10.71% increase over the past day dragging the price from $2.04 to $1.91.
The 24-hour trading volume for Helium decreased by 72% to $7,234,778, and the market capitalization also decreased by 11.03% to $257,595,756, which indicate significant market volatility.
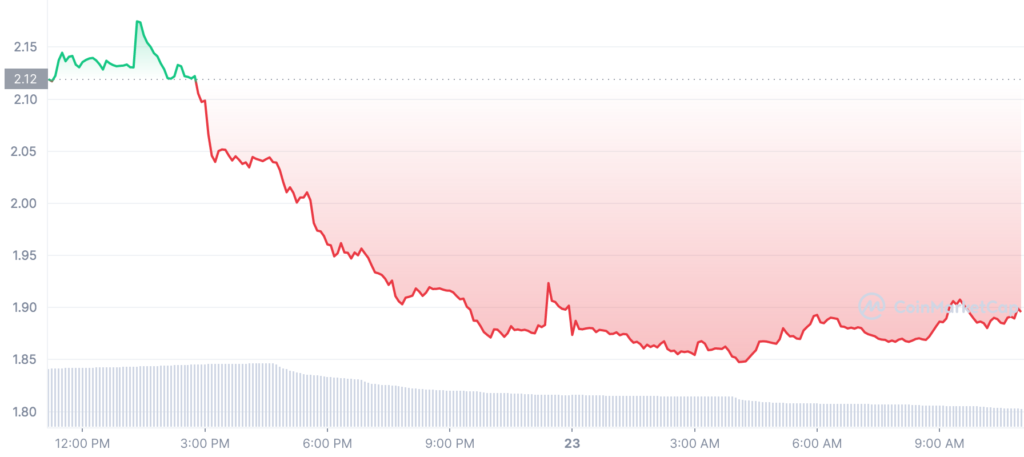
The price analysis for Helium reveals that the coin has been downgrading steadily for 24 hours. The price level has decreased to $1.91 thanks to the bearish momentum. Earlier, the price of Helium soared to a new resistance level of $2.02.
The price then remarkably fell due to the bear’s dominance in the HNT market. They have achieved to push down HNT’s price below two support levels of $2.02 and$1.922 due to the current bearish momentum.
Significantly, bears took control of the HNT market after setting solid support near $1.833, pushing prices lower all day.
Despite the decline in price, a “strong buy signal” from the technical analysis indicator suggests that the rise in HNT will likely come in the short term. The technical ratings have entered the positive territory with a rating of 0.51 and support the bullish premise underpinning the HNT market.
However, the stochastic RSI is currently above the overbought level and sits at 83, which worries traders since it suggests that the asset will become overbought. More highs are anticipated in the near term if the stochastic RSI readings are over 85, indicating that the market has not yet reached its peak.
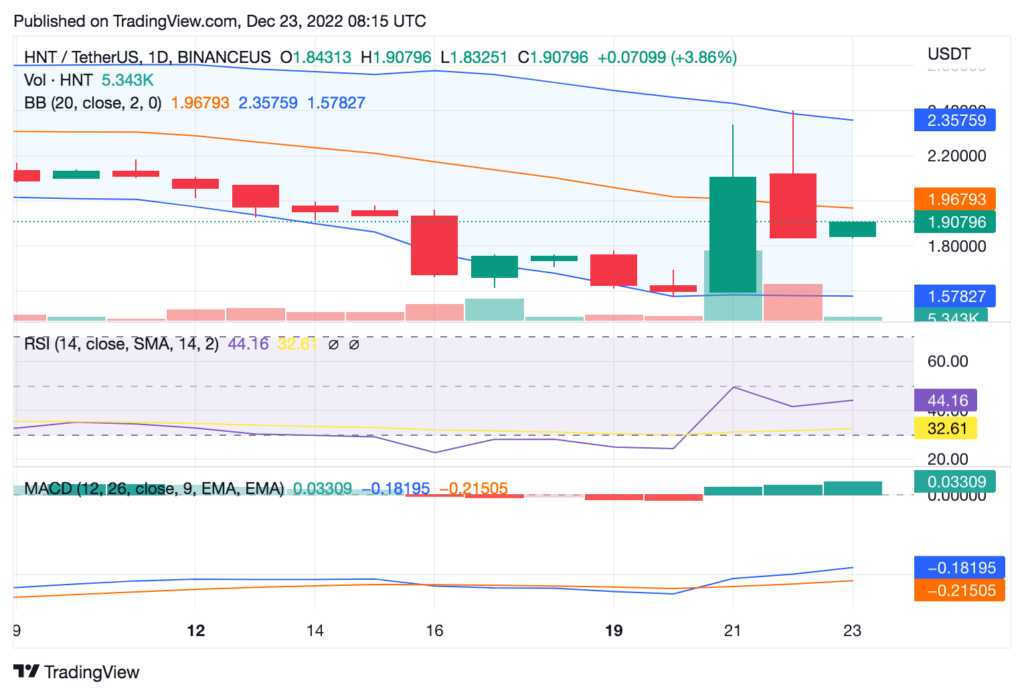
As HNT showed bullish signal in the past week, the 9-day moving average of the grap has risen above the candlesticks, but the 20-day simple moving average is still below its 50-day mean.
In addition, the Bollinger bands are expanding while the price rises, demonstrating good momentum and a significant level of market participation.
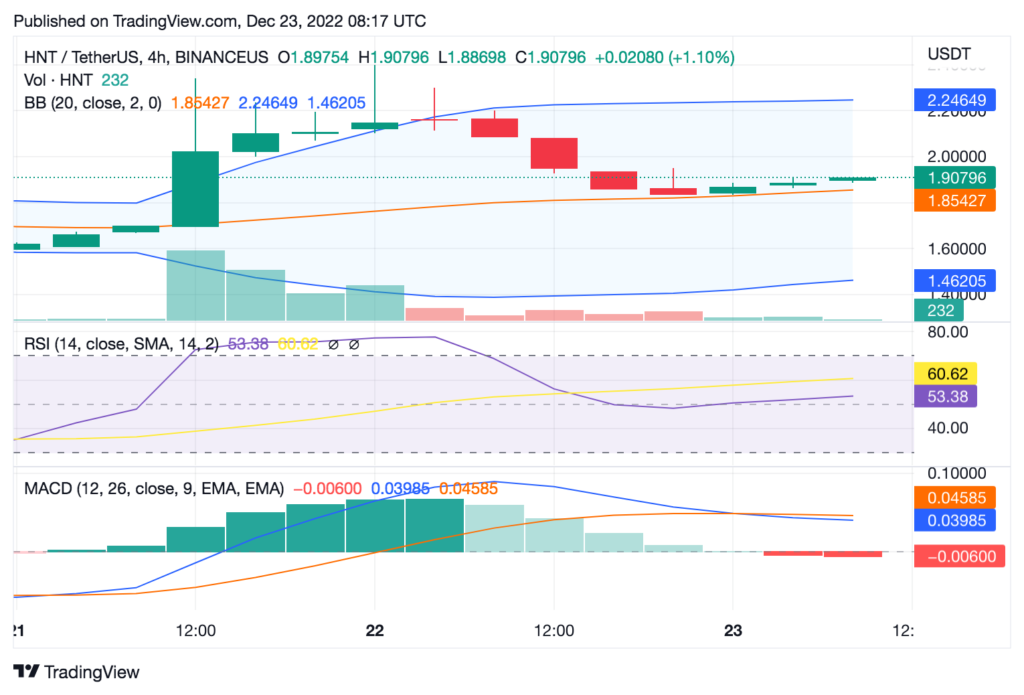
The MACD displays a negative divergence on the 4-hour chart, but the momentum line has crossed below the signal line and is displaying a wavy trend.
In a 4-hour time frame, the bulls have once again found some strength to drive HNT/USD prices a bit higher. HNT has anchored itself around $1.91 at press time, and the forecast predicts a possible reversal soon.
The bulls will attempt to gain the upper hand on the four-hour interval chart as the moving index sits around $1.92 after reversing the downward momentum. The Bollinger bands indicator shows a $2.24 upper and a $1.457 lower value, indicating the possibility of price oscillations.
Disclaimer: The views and opinions, as well as all the information shared in this price analysis, are published in good faith. Readers must do their own research and due diligence. Any action taken by the reader is strictly at their own risk, Coin Edition and its affiliates will not be held liable for any direct or indirect damage or loss.
Disclaimer: The information presented in this article is for informational and educational purposes only. The article does not constitute financial advice or advice of any kind. Coin Edition is not responsible for any losses incurred as a result of the utilization of content, products, or services mentioned. Readers are advised to exercise caution before taking any action related to the company.

: What Happens If You Use an Unlicensed Platform?")


