


- Loopring (LRC) is currently in a bullish market sentiment.
- The coin formed a bearish engulfing candlestick on the 4-hour chart.
- LRC has established a firm support level at $0.2598.
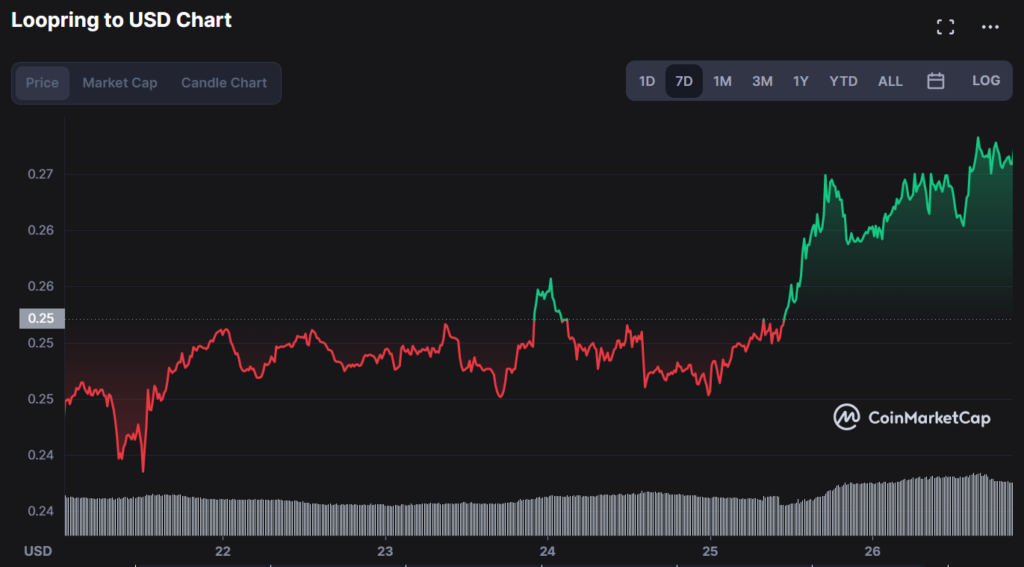
Loopring’s (LRC) price action over the last 24 hours indicates a steady uptrend as the digital asset has traded in the range of $0.26 and $0.271 and is trading at $0.270 at press time. LRC opened the daily trading session at an intra-day high of $0.271, a price level not seen since late June.
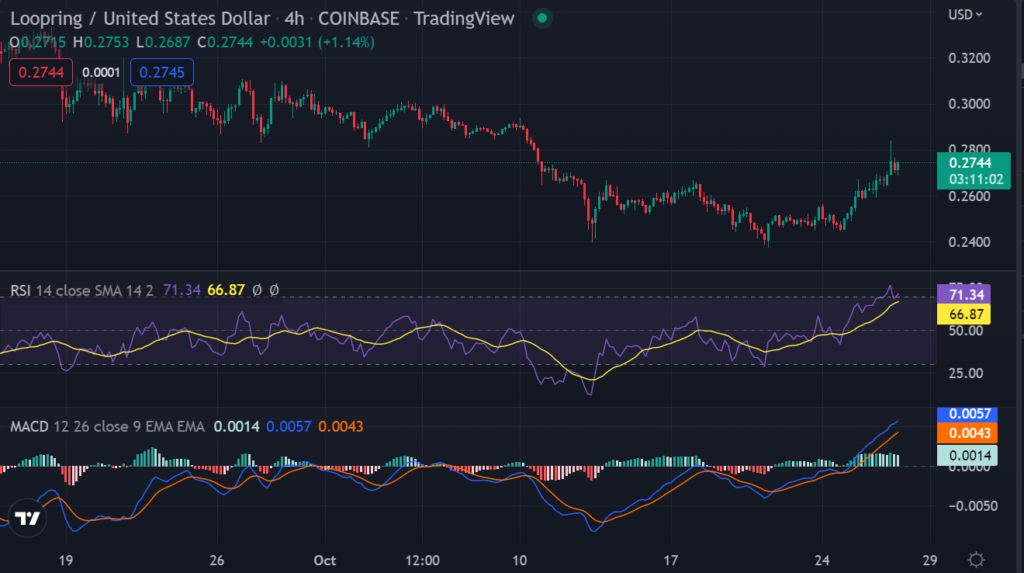
The 4-hour chart shows that LRC formed a bearish engulfing candlestick, indicating possible selling pressure in the short term. However, the bulls seem to be pushing for higher highs, as reflected by the bullish extension on the hourly chart.
According to technical analysis, Loopring has established a strong support level at $0.2598 and is currently holding above it. This indicates that LRC may continue its uptrend in the short term.
Traders should pay attention to the $0.2781 resistance level as well as any potential retracement to the support levels at $0.2598 and $0.2493.
LRC is currently ranked 98 and has a market dominance of 0.04%, according to CoinMarketCap. The digital asset has a market cap of approximately $363,035,151.97 and a 24-hour trading volume of $56,526,447.67. LRC’s price has increased by 5.92% in the last 24 hours.
The increased buying activity and the bullish extension seen on the hourly chart suggest that LRC may continue its uptrend. The Bollinger bands indicator on the 4-hour chart also shows increasing volatility and a possible breakout in either direction. The upper band is touching the key resistance level at $0.2781, and the lower band is holding above the support levels at $0.2598 and $0.2493, indicating a possible continued uptrend in the short term.
Looking at the technical analysis on the daily chart, LRC formed a bullish engulfing candlestick and is currently trading above the 50-day and 200-day moving average, indicating a bullish market sentiment.
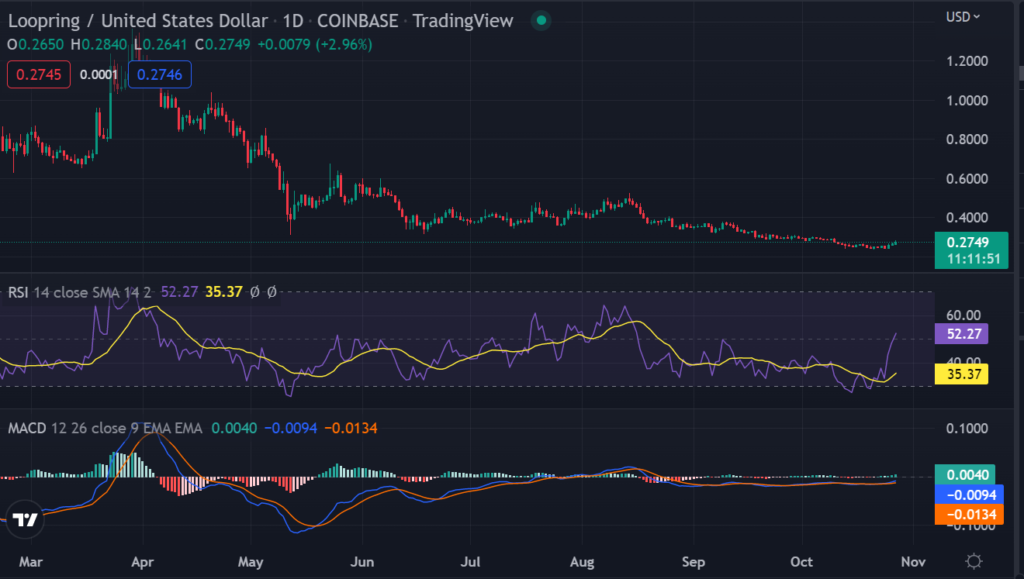
The MACD shows increasing bullish momentum as the MACD line (blue) crosses above the signal line. However, traders should also pay attention to any bearish crossover, as a sloping trendline is likely on the 4-hour chart.
In the 4-hour chart, a continuation of an ascending triangle can also be seen, with the triangle’s support level currently holding. This bullish pattern could potentially lead to a breakout in the upward direction for LRC prices.
The RSI indicator is at 70, showing that the digital asset is currently in overbought territory.
LRC seems to be facing bullish pressure as it heads toward higher highs. The Fibonacci Retracement tool shows potential resistance levels at $0.2781, $0.2878, and $0.2988 zones. On the flip side, support levels are seen at $0.2598, $0.2493, and $0.2394, respectively.
Disclaimer: The views and opinions, as well as all the information shared in this price prediction, are published in good faith. Readers must do their research and due diligence. Any action taken by the reader is strictly at their own risk. Coin Edition and its affiliates will not be held liable for any direct or indirect damage or loss.
Disclaimer: The information presented in this article is for informational and educational purposes only. The article does not constitute financial advice or advice of any kind. Coin Edition is not responsible for any losses incurred as a result of the utilization of content, products, or services mentioned. Readers are advised to exercise caution before taking any action related to the company.
 Price Prediction: Can BTW Sustain Its Breakout Above $0.1032?")


