


- Technical indicators predict that negative domination will continue.
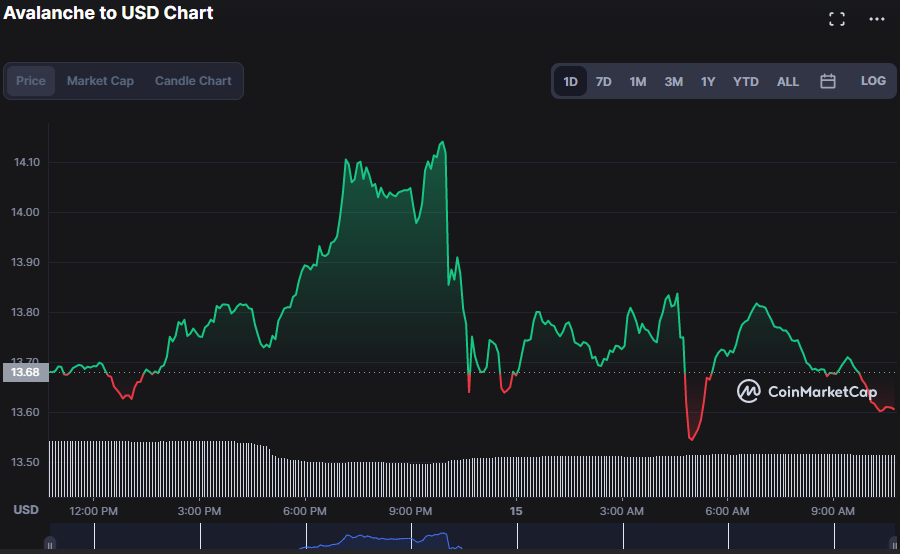
- The support level for AVAX is $13.52, while the resistance level is $14.16.
- AVAX prices have dropped by more than 0.53% in the previous hours.
Bears’ repeated efforts to grab control of the Avalance (AVAX) market throughout the day have finally succeeded. During the downtrend, AVAX bears dragged the price down to $13.59, a 0.80% drop.
The 0.78% dip in market capitalization to $4,218,837,991 and the 24.36% decrease in trading volume to $223,483,079 point to a negative trend. In a downturn, dropping volume may indicate a reversal and a good buying time.
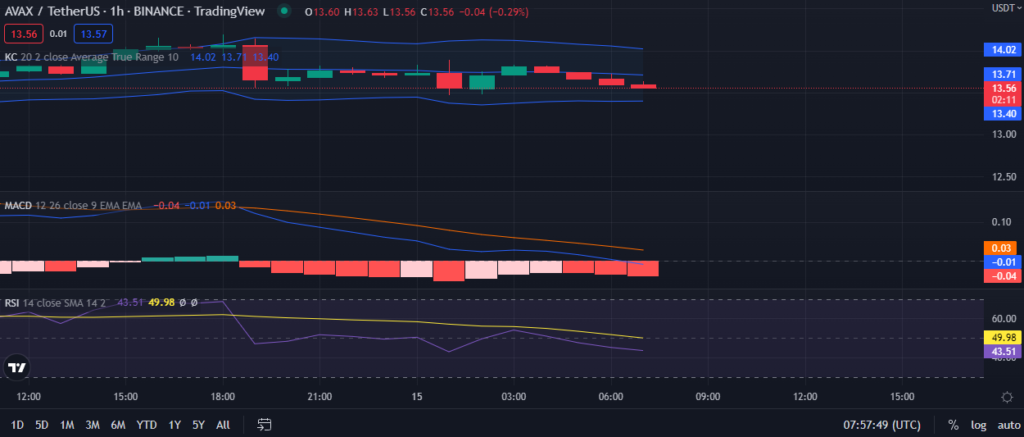
The Keltner Channel is trending downward and shrinking, indicating that the negative momentum will persist since the upper band reaches $14.02 and the bottom band reaches $13.40. The price’s decline towards the bottom band also validates this theory, indicating that bears’ zeal is growing.
It is speculated that a bearish trend is emerging when the blue MACD line goes below the red signal line into negative territory at -0.01. This notion is supported by the fact that the histogram trend is likewise negative, at -0.04.
With an RSI of 43.90, the market is under selling pressure, implying bear domination. The current dip below its SMA line adds to this dismal trend and worries investors that a bear persistency is on the horizon.
When the True Strength Indicator crosses below the signal line from above, it signals that bears are dragging prices down to allow for this movement. This can be observed on the AVAX 4-hour price chart, where the TSI is at -0.7548 and headed south, indicating a strengthening bear grip.
On the 4-hour chart, the Bollinger Bands are also narrowing, indicating that the downturn is likely to continue. The upper band reaches $14.08, while the bottom band reaches $13.47, showing a downward trend. The market price is also sliding toward the bottom band, adding to the declining trend.
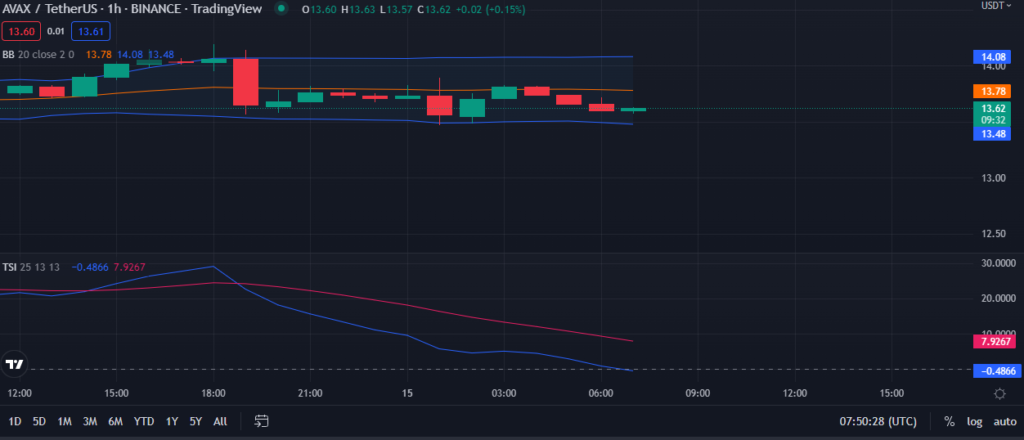
Consequently, the bulls must continue to struggle and overwhelm the bears to reclaim their position in the AVAX market.
Disclaimer: The views and opinions, as well as all the information shared in this price analysis, are published in good faith. Readers must do their own research and due diligence. Any action taken by the reader is strictly at their own risk, Coin Edition and its affiliates will not be held liable for any direct or indirect damage or loss
Disclaimer: The information presented in this article is for informational and educational purposes only. The article does not constitute financial advice or advice of any kind. Coin Edition is not responsible for any losses incurred as a result of the utilization of content, products, or services mentioned. Readers are advised to exercise caution before taking any action related to the company.
 Price Prediction: Can BTW Sustain Its Breakout Above $0.1032?")


