


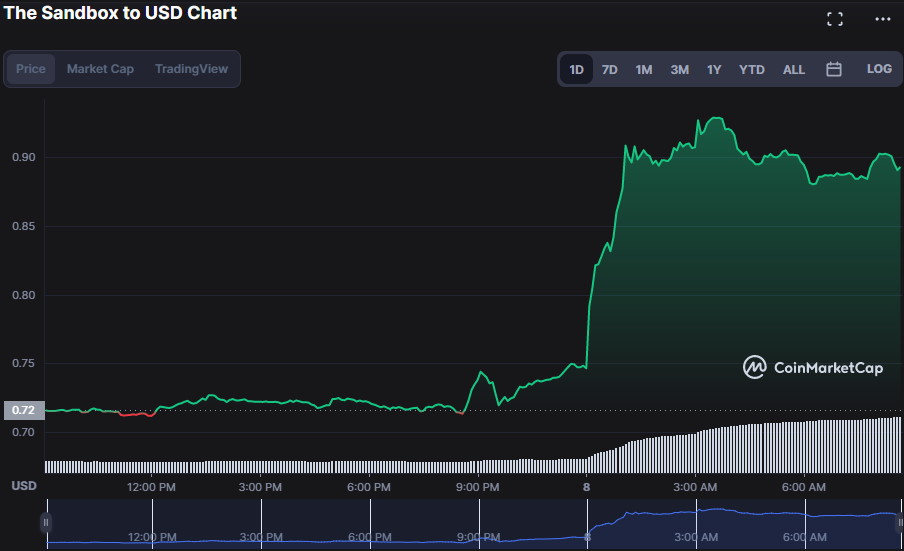
- In the previous 24 hours, bullish persistence has sent the SAND price to a new 90-day high.
- SAND’s price has varied between $0.7103 and $0.9365 in the last 24 hours.
- Bulls must break the present resistance to achieve new highs.
After finding support at $0.7103, bullish pressure on the Sandbox (SAND) market has been rising gradually. Thanks to the perseverance of the bulls, the price of SAND has increased to $0.9365, a new 90-day high in the previous 24 hours. At the time of publication, the bullish momentum has sent SAND’s price up to $0.8885, a 24.19% increase.
The market cap has climbed by 24.13 % to $1,332,244,643, and the 24-hour trading volume soared by 426.21 % to $804,402,999, possibly due to the heightened interest in the market and expectations of a sustained bull run.
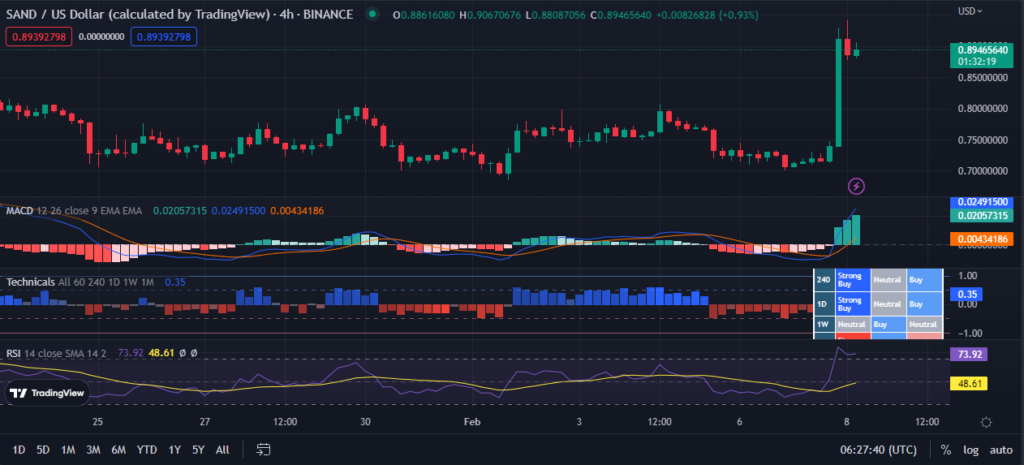
As shown on the 4-hour price chart, the MACD line has soared over its signal line at 0.02493918, indicating strong upward momentum in the market and lending credence to this optimistic view. The high positive MACD reading is a bullish indicator since it suggests that purchasing pressure will intensify soon. In addition, the MACD histogram is green and rising, signaling buyers are strengthening their hold on the market.
The technical rating indicator is flashing a strong buy’ signal around 0.45, suggesting the positive trend may continue. This indication suggests that the market attitude is firmly in favor of bulls, which may pave the way for further price growth.
The relative strength index (RSI) is now trading above 50, indicative of a bullish market environment where prices are likely to rise soon. Nonetheless, the RSI is close to entering the overbought zone at 73.95, suggesting that the price may shortly enter a period of consolidation. Therefore, despite the market’s positive trend, investors should exercise caution before taking a long position due to the possibility of profit booking at higher levels.
The SAND market is extremely overbought, indicating that the current upward trend is about to end. The current stochastic RSI value is 90.89. As a result, the SAND market may collapse dramatically, during which prices will fall as opposing forces gain sway.
Nonetheless, given that the Rate of Change (ROC) is favorable at 25.31, this might mean that negative pressures in the SAND market are minimal and that prices might remain constant or improve somewhat soon.
Bearish pressures in the SAND market may not be strong enough to send prices much lower despite the stochastic RSI reading, as indicated by a positive Rate of Change (ROC).
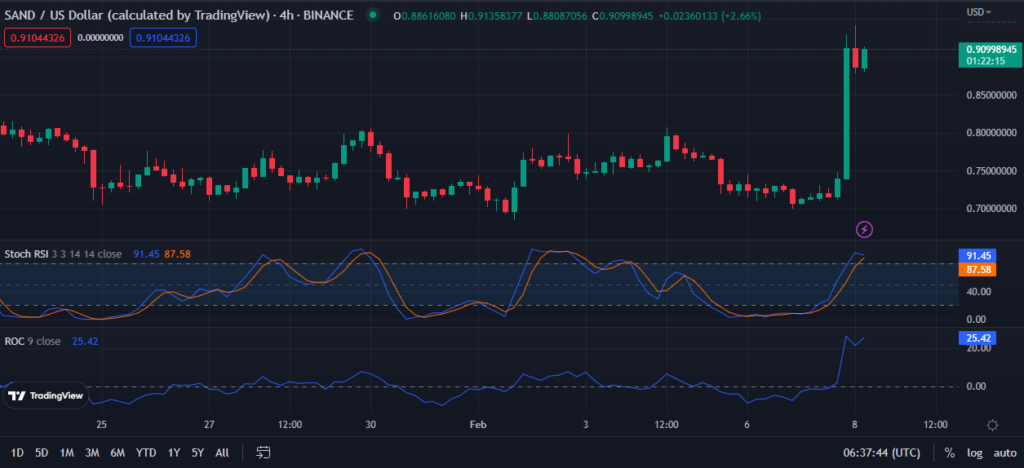
Although the stochastic RSI shows that the SAND market is overbought, other indications suggest bulls can extend their march higher.
Disclaimer: The views and opinions, as well as all the information shared in this price analysis, are published in good faith. Readers must do their own research and due diligence. Any action taken by the reader is strictly at their own risk, Coin Edition and its affiliates will not be held liable for any direct or indirect damage or loss.
Disclaimer: The information presented in this article is for informational and educational purposes only. The article does not constitute financial advice or advice of any kind. Coin Edition is not responsible for any losses incurred as a result of the utilization of content, products, or services mentioned. Readers are advised to exercise caution before taking any action related to the company.


