


 Price Prediction 2024-2030: Will SAND Price Hit $1.5 Soon?")
- SAND might reach $0.96 to $3.20 by 2025, driven by post-BTC halving effects.
- 2028’s BTC halving could push SAND to surpass its previous ATH, reaching $9.25.
- By 2040, SAND might achieve $28.50 to $40.50, propelled by technological advancements.
In 2020, Sandbox’s SAND token burst onto the cryptocurrency scene, capturing the attention of eager investors as its value climbed steadily. A year later, SAND reached a monumental milestone, soaring its all-time high of $8.44 on November 25, 2021.
But the celebration was short-lived. SAND began to falter as quickly as it ascended, facing a relentless wave of bearish sentiment that chipped away at its value. The once-promising token found itself clinging to the $0.20 support level, leaving investors uncertain.
Has SAND’s star faded, or is it on the verge of a dramatic comeback? Our in-depth price predictions and technical analysis will answer these burning questions, shedding light on SAND’s future trajectory in the volatile crypto market.
Table of contents
- The Sandbox (SAND) Real-Time Market Overview
- What is Sandbox (SAND)?
- The Sandbox (SAND) Current Market Status
- The Sandbox (SAND) Price Analysis 2024
- The Sandbox (SAND) Price Prediction 2024-2030
- The Sandbox (SAND) Price Prediction 2024
- The Sandbox (SAND) Price Prediction 2025
- The Sandbox (SAND) Price Prediction 2026
- The Sandbox (SAND) Price Prediction 2027
- The Sandbox (SAND) Price Prediction 2028
- The Sandbox (SAND) Price Prediction 2029
- The Sandbox (SAND) Price Prediction 2030
- The Sandbox (SAND) Price Prediction 2040
- FAQs
The Sandbox (SAND) Real-Time Market Overview
HTTP Request Failed... Error: file_get_contents(https://pro-api.coinmarketcap.com/v2/cryptocurrency/quotes/latest?slug=the-sandbox): Failed to open stream: HTTP request failed! HTTP/1.1 429 Too Many Requests
What is Sandbox (SAND)?
The Sandbox (SAND) is an advanced virtual world on the blockchain that enables creators and players to build, own, and monetize their gaming experiences. At the heart of this community-driven platform is the SAND token, a utility token that empowers users to participate actively in governance and the economy of the gaming metaverse known as LAND.
As a player in The Sandbox, you have the unique opportunity to create digital assets, known as NFTs, and utilize them to create immersive gaming experiences with The Sandbox Game Maker. Yet, what sets The Sandbox apart is its foundation on blockchain technology, which ensures true ownership, digital scarcity, interoperability, and advanced monetization capabilities for its users.
Moreover, using SAND tokens extends beyond governance, enabling stakeholders to purchase, rent, or develop their pieces of LAND, thus adding value to their investments. SAND also facilitates staking, allowing users to generate passive income and earn rewards such as gems and catalysts, which are crucial for crafting superior digital assets.
Every transaction within The Sandbox has a purpose. For instance, a 5% fee on SAND transactions is split, with half allocated to a Staking Pool to reward participants and the other half directed to the Foundation to support quality game production and content creation.
The Sandbox (SAND) Current Market Status
Since hitting its all-time high, the SAND token has been navigating a bearish trend. This downtrend has been particularly pronounced over the past year, with SAND shedding 16.22% of its value. However, despite this decline, the token remains significantly up, boasting an impressive 215% gain from its launch price of $0.06608.
Interestingly, the weekly chart suggests that SAND might be on the brink of a recovery. After dropping to a low of $0.26, the token has climbed above $0.27, with the current price at $0.2729. This reflects a 3.51% increase from the previous day and a 7.05% rise over the past week, hinting at a potential shift in momentum.
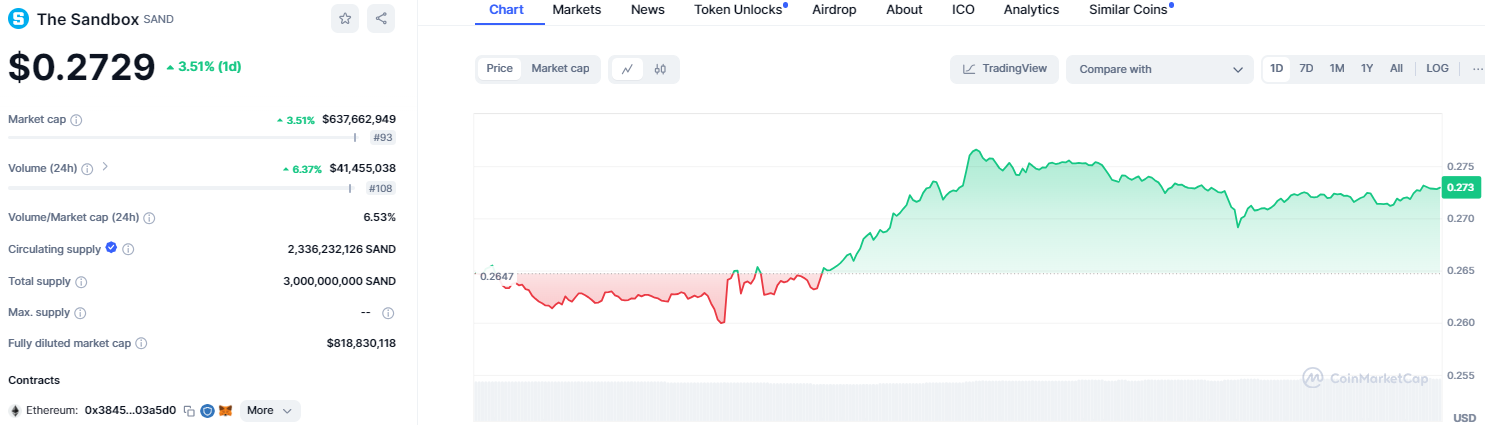
Source: CoinMarketCap
As SAND begins to regain ground, its market cap has also seen a positive shift, now at $637,662,949, placing it in the 93rd spot among cryptocurrencies. The 24-hour trading volume echoes this positive sentiment, climbing 6.37% to $41,455,038.
This uptick in activity suggests growing investor confidence, with the token showing early signs of stability and potential growth. For those with a long-term perspective, the current dips could present an opportunity to accumulate, especially near these oversold levels.
The Sandbox (SAND) Price Analysis 2024
With a circulating supply of 2,336,232,126 SAND out of 3,000,000,000, the token still has room for growth. As The Sandbox project continues to evolve and capture attention within the crypto space, the potential for price appreciation remains on the horizon.
In this section, Coin Edition examines SAND’s price analysis more closely to uncover potential price targets and key levels that could be pivotal in the near term.
The Sandbox (SAND) Price Analysis – Bollinger Bands
SAND’s Bollinger Bands on the weekly chart are narrowing, signaling a potential decrease in price volatility. This tightening range may suggest that the asset is entering a phase of consolidation, where price movement could become more restrained.
Originating from oversold levels near $0.217 along the lower band, SAND is gaining momentum as it approaches the middle band around $0.366. This shift could set the stage for an enticing buying opportunity, especially for traders eyeing a breakout that might propel the price higher.
The Sandbox (SAND) Price Analysis – Relative Strength Index
While still reflecting a bearish sentiment, the RSI index shows signs of a potential reversal. Currently sitting at 37.75, the RSI line is beginning to climb, suggesting that a shift in momentum could be on the horizon.
With plenty of room to grow before hitting overbought territory, SAND might be poised to challenge its recent high around $0.34, possibly targeting the $0.50 level, a significant resistance last encountered in April.
The Sandbox (SAND) Price Analysis – Moving Average Convergence Divergence
Meanwhile, the MACD indicator confirms the short-term bearish outlook, with the MACD line positioned below the signal line in the negative zone at 0.0616. However, the histogram shows a decrease in red bars, approaching the zero line.
This development hints at a potential shift toward bullish momentum, reinforcing the possibility of a rally that could push SAND to test the $0.34 barrier and reach the $0.50 level.
The Sandbox (SAND) Price Prediction 2024-2030
| Price Prediction | Potential Low ($) | Potential High ($) |
| 2024 | $0.10 | $0.96 |
| 2025 | $0.96 | $3.2 |
| 2026 | $0.49 | $4.50 |
| 2027 | $2.52 | $6.96 |
| 2028 | $4.70 | $9.25 |
| 2029 | $6.96 | $14.82 |
| 2030 | $9.75 | $19.00 |
| 2040 | $28.50 | $40.50 |
The Sandbox (SAND) Price Prediction 2024
The DMI indicator shows a strengthening bearish trend, as the ADX sits at 26.4533, indicating solid downward momentum. The -DI significantly outpaces the +DI, with values of 29.7333 and 13.033, respectively, suggesting that the selling pressure will likely persist in the near term.
Referencing these conditions, analysts foresee a potential decline in SAND’s value, with support possibly emerging around $0.146, a level last seen in June 2021. Yet, should this support fail, the token could be pushed further down to test the psychological $0.10 level.
On the other hand, if the momentum shifts and SAND holds its ground, the token could rally toward the $0.50 barrier, aligned with the 50% Fibonacci retracement level. A breakthrough here could pave the way for SAND to retest its previous high of $0.96, offering a bullish outlook for investors.
The Sandbox (SAND) Price Prediction 2025
According to our forecast, SAND might rise to $3.2, driven by post-BTC halving momentum. Market corrections could lower it to $0.96 as the excitement fades, reflecting typical post-halving market adjustments.
The Sandbox (SAND) Price Prediction 2026
As the previous BTC halving hype begins to wane, Sandbox’s price prediction projects a potential market correction, pulling SAND’s value to retest its earlier low around the $0.49 level. A subsequent price recovery could push the token toward $4.50.
The Sandbox (SAND) Price Prediction 2027
Following 2026’s market recovery, SAND is anticipated to peak at $6.96 in 2027, fueled by growing anticipation for the 2028 BTC halving. However, a bearish market trend could bring it down to $2.52 during the year.
The Sandbox (SAND) Price Prediction 2028
Coin Edition forecasts SAND could climb past its all-time high in 2028, potentially peaking at $9.25, driven by the BTC halving event. Nonetheless, market volatility could later reduce its value to $4.70 as speculative activity settles.
The Sandbox (SAND) Price Prediction 2029
As per our analysis, SAND might hit $14.82, supported by strong community engagement and continued interest. If the market weakens, the token could decline to $6.96.
The Sandbox (SAND) Price Prediction 2030
According to our price forecast, SAND could reach $19.00 with market maturity. A downturn or external factors might lower it to $9.75, reflecting broader market instability.
The Sandbox (SAND) Price Prediction 2040
As Coin Edition suggests, technological advances could propel SAND to $40.50. However, a severe market correction, influenced by potential market volatility and economic factors, could decrease its value to $28.50.
FAQs
Sandbox (SAND) is a blockchain-based virtual world where users can create, own, and monetize gaming experiences. SAND is the platform’s utility token for governance, transactions, and staking.
SAND can be purchased on major cryptocurrency exchanges like Binance, Coinbase, and Kraken. You must create an account, deposit funds, and trade for SAND.
SAND’s potential depends on the metaverse’s growth and adoption. While it has long-term potential, it also carries market volatility risks.
SAND’s all-time high is $8.44, reached on November 25, 2021.
According to our forecast, market trends and community support could drive SAND to reach $5 by 2029.
Currently, the circulating supply of SAND is 2,336,232,126 tokens out of a total supply of 3,000,000,000.
SAND could surpass its current ATH in 2028, potentially reaching $9.25, due to BTC’s halving and growing adoption.
The lowest recorded price for SAND is $0.02894, which occurred in November 2020.
Arthur Madrid and Sébastien Borget co-founded Sandbox.
The Sandbox was launched in 2012, initially as a mobile game—however, the blockchain version with SAND as a token was launched in 2020.
SAND can be stored in a cryptocurrency wallet like MetaMask, Trust Wallet, or any wallet supporting ERC-20 tokens.
According to our forecast, SAND’s price could range between $0.10 and $0.96 in 2024, depending on market trends and adoption.
According to our analysis, SAND might range from $0.96 to $3.20 in 2025, influenced by the post-BTC halving momentum.
Per our predictions, SAND’s price could range from $0.49 to $4.50 in 2026, reflecting market corrections and potential recovery.
2027 SAND might fluctuate between $2.52 and $6.96, driven by anticipation for the 2028 BTC halving.
Per Coin Edition, SAND could range from $4.70 to $9.25 in 2028, boosted by the BTC halving and speculative interest.
SAND might trade between $6.96 and $14.82 in 2029, supported by strong community engagement and market growth.
According to our forecast, SAND’s price could range from $9.75 to $19.00 in 2030, reflecting market maturity and broader adoption.
SAND might reach $28.50 to $40.50 in 2040, driven by technological advancements and long-term growth.
Disclaimer: The information presented in this article is for informational and educational purposes only. The article does not constitute financial advice or advice of any kind. Coin Edition is not responsible for any losses incurred as a result of the utilization of content, products, or services mentioned. Readers are advised to exercise caution before taking any action related to the company.
 Price Prediction: Can BTW Sustain Its Breakout Above $0.1032?")


