
- According to the latest data, GALA has been on a rising trend in the last 24 hours.
- Technical indicators suggest that the bull run may be coming to a close.
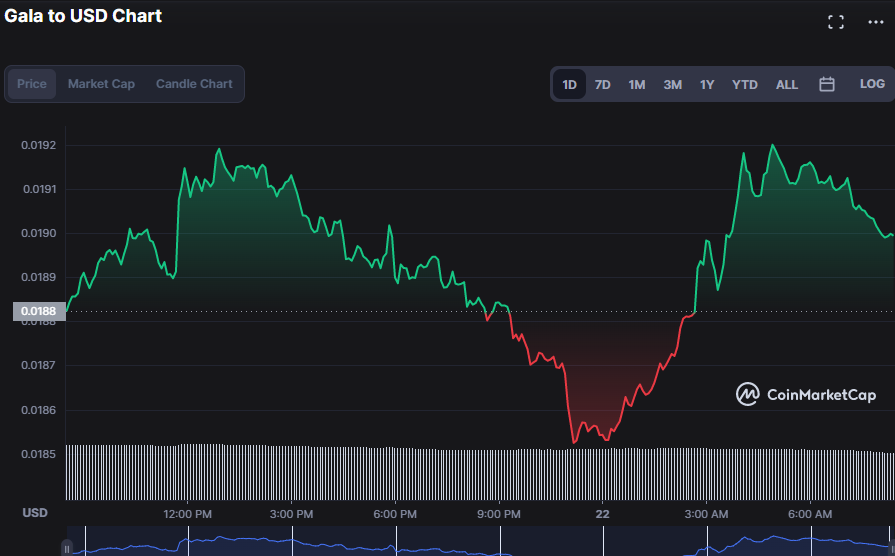
- Gala prices have ranged between $0.01852 and $0.01922 in the previous 24 hours.
Over the last day, Gala (GALA) has been gaining ground on the bullish front, which has catapulted it back into the top 10 most-bought tokens among the 500 largest #ETH whales over the past day.
Prices rose throughout the day thanks to this upward trend, although bears grabbed control briefly until the market found support around $0.01852. Bulls had managed to push GALA’s price to $0.01893 as of press time, with 0.19% increase. The increase in market value by 1.05% to $132,532,360 is supportive of this bullish pattern, but the decline in 24-hour trading volume of 14.21% to $44,618,104 may indicate that it is time to sell and pocket gains.
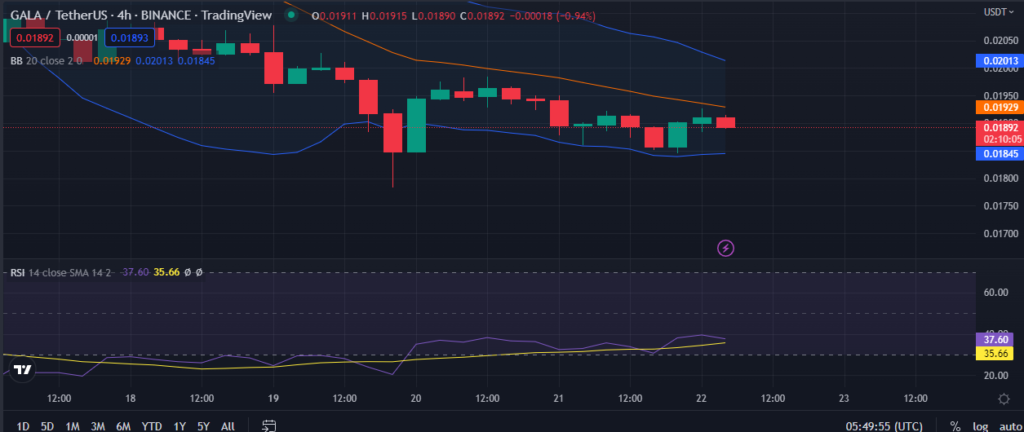
In the GALA price chart, the upper Bollinger Band is at $0.02013 and the lower Band is at $0.01845 (contracting), indicating that the Bull Market is beginning to wane. A further indication that the current market trend may not persist is that prices have been inching up toward the lower band, suggesting that bear strength is likely to happen
The GALA market is seeing selling pressure, as shown by the RSI reading of 37.70, suggesting that the current bullish run may be coming to an end. The RSI is still above its SMA, indicating that bulls may still have a chance; however, this does not guarantee a price decrease and instead recommends investors to remain watchful.
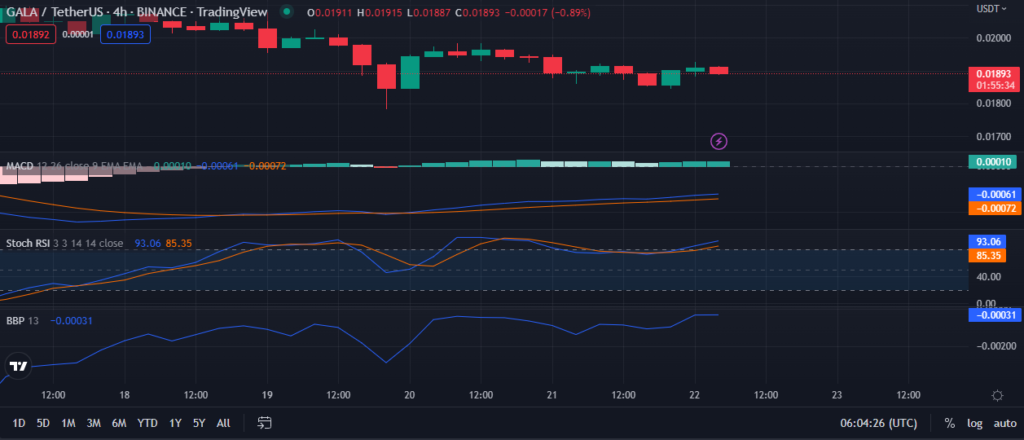
This bullish ascent in the Gala market is expected to come to an end as the stochastic RSI moves into the overbought area with a reading of 92.69. When the stochastic RSI reaches 80, the bullish trend is often seen to have peaked.
The moving average convergence divergence (MACD) moves in the negative zone, validating this bear forecast. With a value of -0.00062, it exceeds its signal line, indicating that bulls may still have a chance. The trend of the histogram in the positive section of the 4-hour price chart backs up this belief.
A negative trend (-0.00031) in Bull Bear Power (BBP) further dampens the GALA market’s positive momentum. This action indicates that the bears are getting closer to achieving a decisive victory against the bulls in the market.
If the bulls can maintain the resistance level, the GALA market might experience even greater jubilation.
Disclaimer: The views and opinions, as well as all the information shared in this price analysis, are published in good faith. Readers must do their own research and due diligence. Any action taken by the reader is strictly at their own risk. Coin Edition and its affiliates will not be held liable for any direct or indirect damage or loss.
Disclaimer: The information presented in this article is for informational and educational purposes only. The article does not constitute financial advice or advice of any kind. Coin Edition is not responsible for any losses incurred as a result of the utilization of content, products, or services mentioned. Readers are advised to exercise caution before taking any action related to the company.


 Price Prediction: UNI Eyes $5 as UNI Extends Bullish Breakout")

