


- BTC bulls seize market trend, rendering bears’ effort to reverse trend illegitimate.
- According to technical indicators, bulls are predicted to maintain their lead in the Bitcoin market.
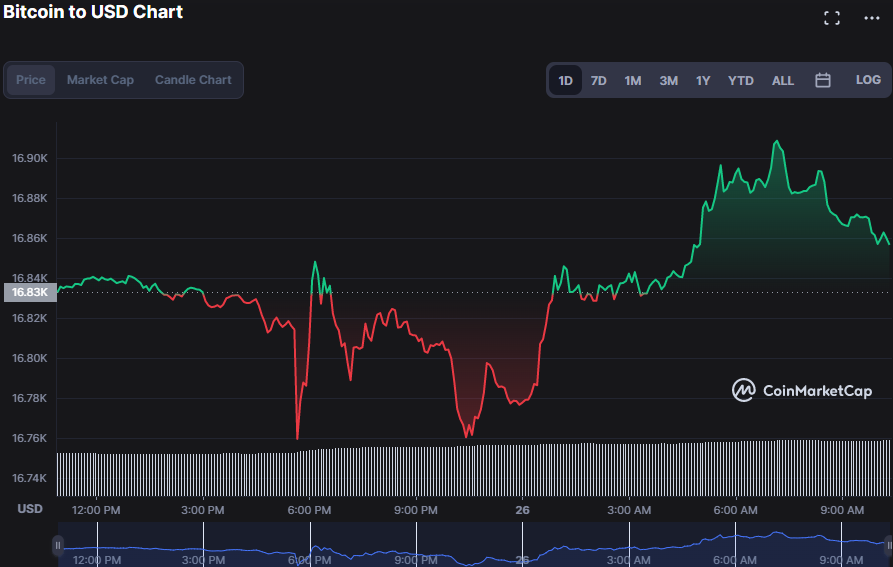
- BTC has found support in the past 24 hours at $16,755.25.
Bears in the Bitcoin (BTC) market retraced the price to $16,755.25 in the previous 24 hours before bulls found support. Later in the day, the bulls regained control of the market, and the price rose to $16,908.86 before reversing. As of press time, the positive trend managed to value BTC at $16,861.67 (a 0.13% rise).
The Bitcoin (BTC) market capitalization increased to $324,365,826,978, and the 24-hour price chart increased by 31.34% to $12,406,915,053 as a result of this rise, indicating that market activity is escalating.
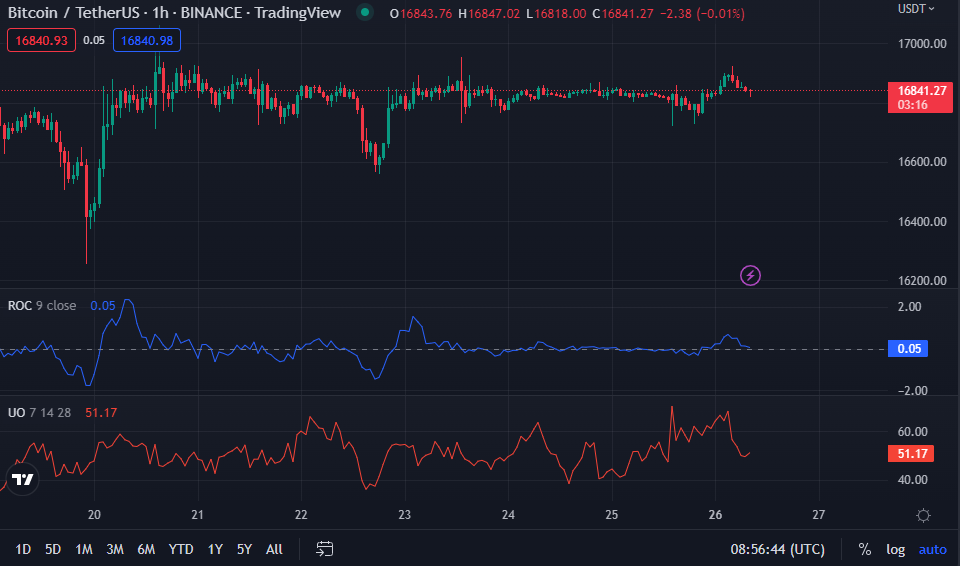
Since the Rate of Change (ROC) is falling and extremely near to the “0” line at 0.03, the bullish momentum in the BTC market may reverse if bulls don’t apply pressure. However, the current Ultimate Oscillator reading (51.47), which indicates that bulls are maintaining control of the Bitcoin market in the near term, dampens this idea. This is because purchasing pressure is equivalent to selling pressure. Investors should proceed with care since the breakout might occur in any direction following this shift.
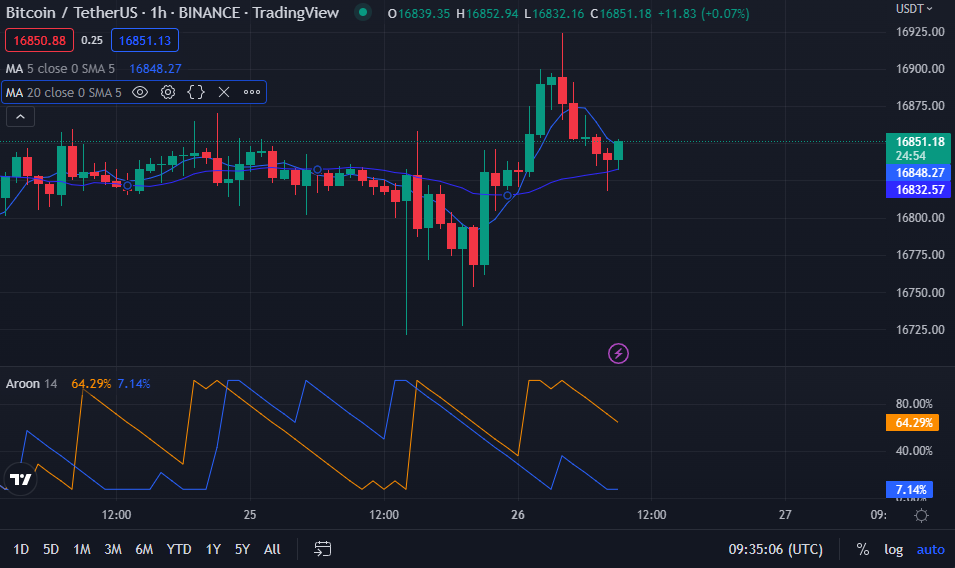
The start of a new upward trend is signaled by the Aroon-Up crossing above the Aroon-Down. Since the orange Aroon up (64.29%) is greater than the blue Aroon down (7.14%) on the BTC price chart, it follows that the current bull run has not yet reached its high. With the aroon indicator on the move, there is reason to be hopeful for even more triumph.
When the BTC market’s 5-day moving average (MA) rises above the 20-day MA, that’s a sign of bullish momentum. This is reflected in the 16846.95 value for the 5-day moving average (MA) and the 16832.20 value for the 20-day MA (1-hour) on the price chart. Moreover, the appearance of a bullish engulfing candlestick suggests that the current bull trend may continue in the near term.
If the BTC bulls can maintain the resistance level, the bullish trend will continue; but, if the bulls’ strength wanes, prices may move towards the support level.
Disclaimer: The views and opinions, as well as all the information shared in this price analysis, are published in good faith. Readers must do their own research and due diligence. Any action taken by the reader is strictly at their own risk. Coin Edition and its affiliates will not be held liable for any direct or indirect damage or loss.
Disclaimer: The information presented in this article is for informational and educational purposes only. The article does not constitute financial advice or advice of any kind. Coin Edition is not responsible for any losses incurred as a result of the utilization of content, products, or services mentioned. Readers are advised to exercise caution before taking any action related to the company.

: What Happens If You Use an Unlicensed Platform?")


