


- Despite recent bullish candles, BNB’s buying momentum was a little dodgy.
- The KST needs to make a higher low while BNB needs a lower low for a bullish confirmation.
- If the ADX and the +DMI fail to increase, then BNB may not hit $245 in the short term.
Binance Coin (BNB) has been exhibiting both strong price surges and occasional pullbacks in recent times. But since August 7, the consolidation period seems to have ended as BNB pushed upwards, and broke above the $240 resistance.
However, a key question may have emerged in the minds of market participants— can BNB maintain its position above the crucial support level of $240.80?
Well, from the technical outlook, the cryptocurrency is unlikely to face massive downward pressure due to the increased buying momentum.
Little Signs of Weakness
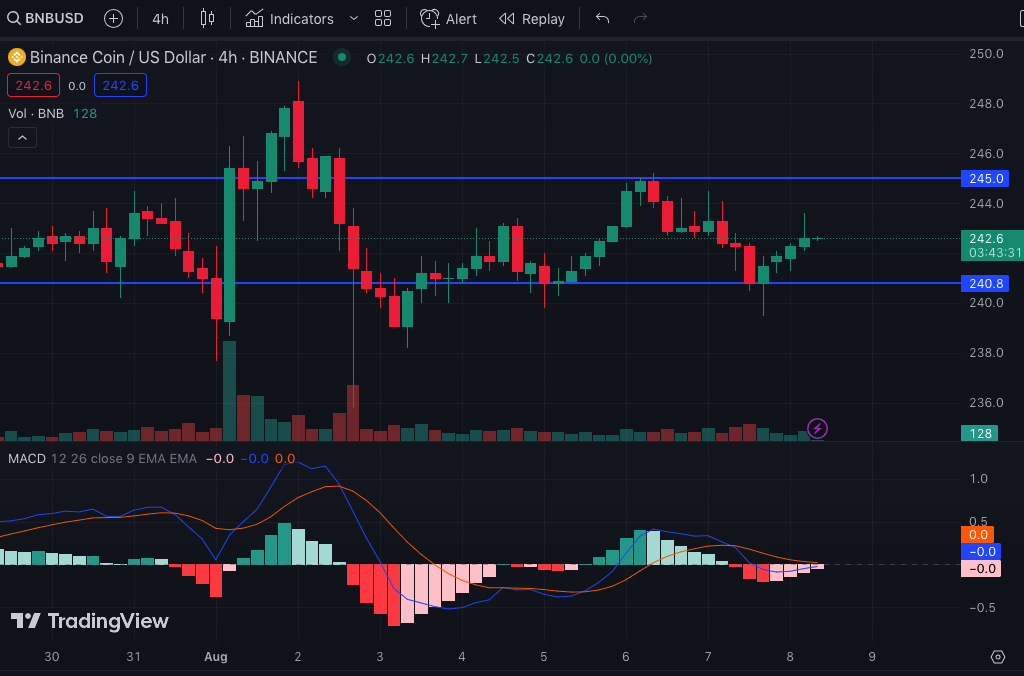
This is because the BNB/USD 4-hour chart showed that the last five candles have been bullish engulfing ones, which confirms how the momentum has shifted in favor of buyers. However, the Moving Average Convergence Divergence (MACD) is already giving signs of weakness, which is one indicator traders need to watch when looking for an entry.
At the time of writing, the MACD was at its neutral zero point. Also, the orange dynamic line was above the blue dynamic line, suggesting that sellers may be making an attempt to take back control.
If the MACD fails to rise into the positive region, then BNB may find it hard to rise as much as $245. But if the buying pressure continues, then the bullish momentum could be confirmed if sellers don’t return in their flock.
Like the MACD, the Know Sure Thing (KST) indicator has flatlined since July 25. But the KST was positive at 1.69. Positive values of the KST suggest bullish momentum while negative values suggest bearish momentum.
BNB Needs a Bullish Divergence
In identifying BNB’s potential trend in the short term, the KST indicated that the coin could sustain the uptrend. But to confirm this, the KST would need to make a higher low while BNB makes a lower low. Whenever this happens, it indicates a bullish divergence and an impending uptrend.
However, BNB might also need a change in the Directional Movement Index (DMI) to confirm the bullish bias. At press time, the +DMI (green) and -DMI (red) hovered around the same point. The current stance of the DMI could lead BNB to revert to consolidation between $240 and $242.
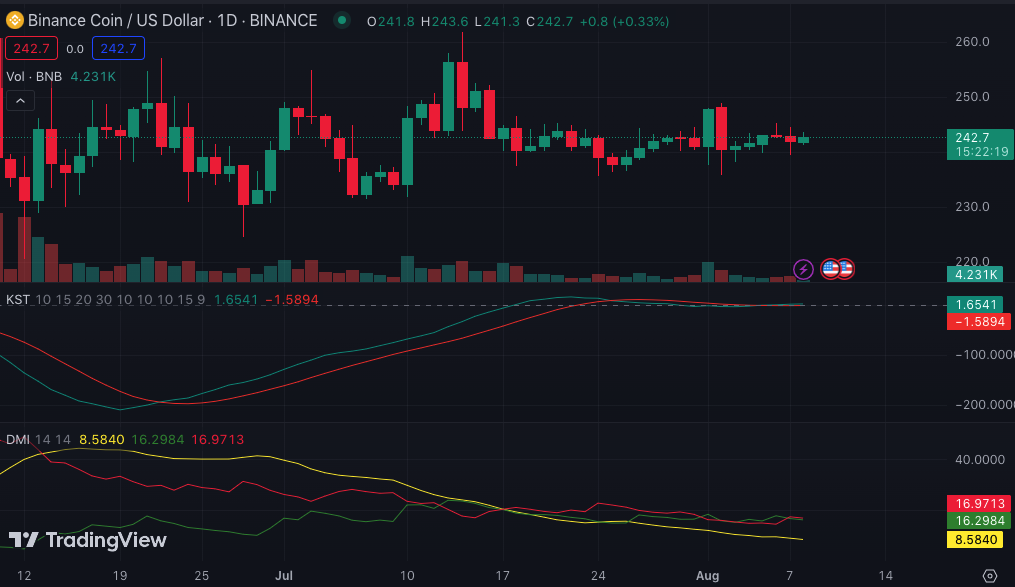
For BNB to rise above $245, the Average Directional Index (ADX) needs to move upward toward a value of 25 in favor of the +DMI. If the ADX doesn’t, then BNB may have to deal with a slight downtrend.
Disclaimer: The views, opinions, and information shared in this price prediction are published in good faith. Readers must do their research and due diligence. Any action taken by the reader is strictly at their own risk. Coin Edition and its affiliates will not be liable for direct or indirect damage or loss.
Disclaimer: The information presented in this article is for informational and educational purposes only. The article does not constitute financial advice or advice of any kind. Coin Edition is not responsible for any losses incurred as a result of the utilization of content, products, or services mentioned. Readers are advised to exercise caution before taking any action related to the company.
 Price Prediction 2026-2030: Will TRX Hit $0.50 Soon?")
 Price Prediction 2026-2050: Will HYPE Hit $100 Soon?")


: What Happens If You Use an Unlicensed Platform?")