


 Hit $20 After Hitting a 30-Day 100% Jump?")
- INJ may hit $16 provided buyers remain the dominant party in the market.
- The MFI needs to avoid stagnancy in order to avoid stalling the INJ price action.
- The 1-hour chart indicated that the $14 to $15 region looks like a good entry point.
Like most altcoins, Injective (INJ) has participated in the broader market rally. At press time, INJ posted a 1.10% decline. But that was only a slight retracement compared to how far the cryptocurrency has come in the last 30 days.
Bears Quench the First Try
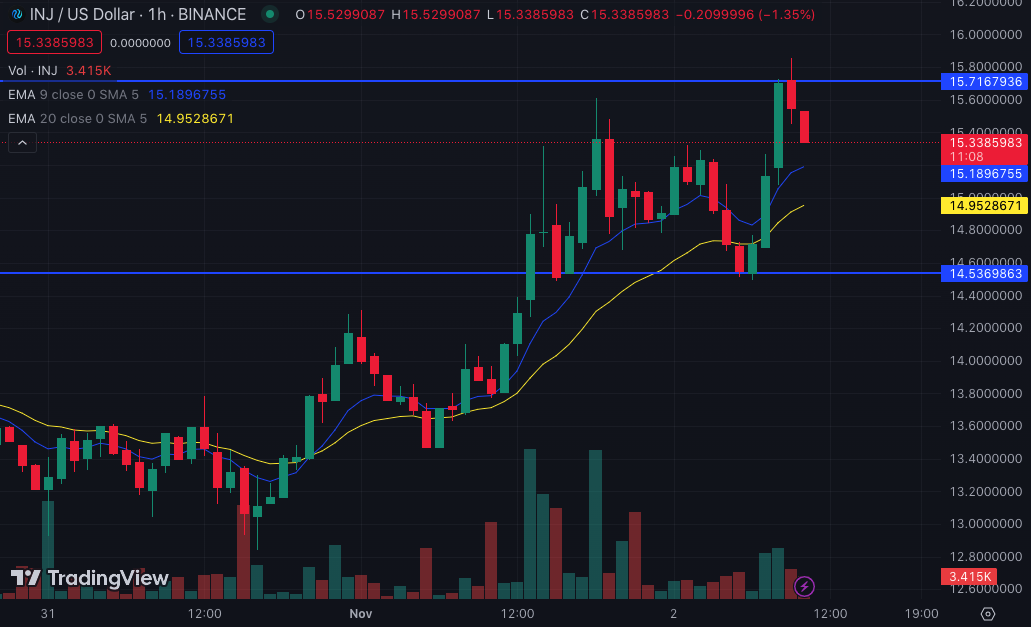
One month ago, the price of INJ was around $7.60, meaning the value has increased by 100% within the said period. On the INJ/USD 1-hour chart, bears are attempting to foil a potential upside targeting $16.
Needless to say, resistance is expected considering the long period of dominance bulls have had. Currently, bulls have opened solid support at $14.53, bringing up speculation that INJ could be set for more gains despite the slight retracement.
One indicator that backed up this notion was the Exponential Moving Average (EMA). As of this writing, the 9 EMA (blue) was above the 20 EMA (yellow). Typically, a move of the 20 EMA above the 9 EMA is deemed bearish. So, the position at press time is considered a bullish signal for INJ. So there’s a chance for INJ to eventually hit $16, provided buyers remain dominant.
Entry Points Are Still Open
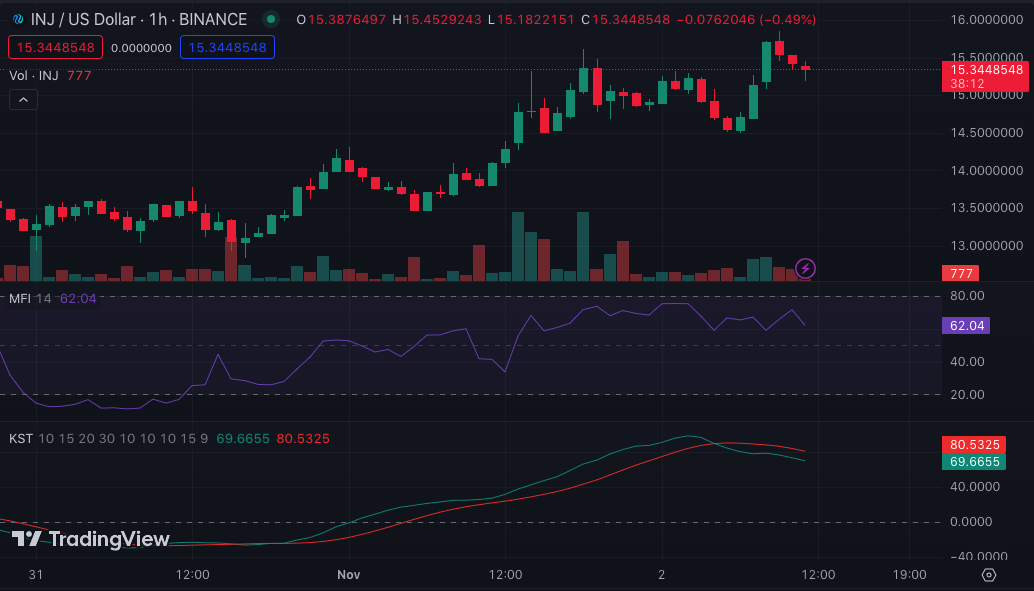
An indicator supporting a bullish continuation for INJ is the Money Flow Index (MFI). The MFI incorporates volume and price action to assess the potential move of an asset. On the 1-hour chart, the MFI was 62.94.
Although this reading was a decrease from the number a few hours before, it’s still a sign that buying pressure was present. Also, since the MFI was not yet 80, there is still room for a price increase if buying pressure continues to increase.
Should the momentum increase northward, then INJ may break above $16 and possibly head toward $20. However, a drop in the MFI could stall INJ’s movement, and it could continue to hover around $15.
Furthermore, both lines of the Know Sure Thing (KST) were very much above the 50.00 midpoint. This indicator measures the price momentum using the Rates Of Change (ROC). Basically, a negative KST favors the bears, and traders may prefer to short at this point.
However, the positive KST reading on the 1-hour INJ/USD chart means that the price is still in a strong uptrend.
From the analysis above, it seems that $14 to $15 is still a good entry point for short-term traders. However, market players need to watch out for the volume at these points before taking a position.
Disclaimer: The information presented in this article is for informational and educational purposes only. The article does not constitute financial advice or advice of any kind. Coin Edition is not responsible for any losses incurred as a result of the utilization of content, products, or services mentioned. Readers are advised to exercise caution before taking any action related to the company.


 Price Prediction 2026, 2027, 2028, 2029, 2030-2050")

