


 Break the $5.28 Resistance Soon?")
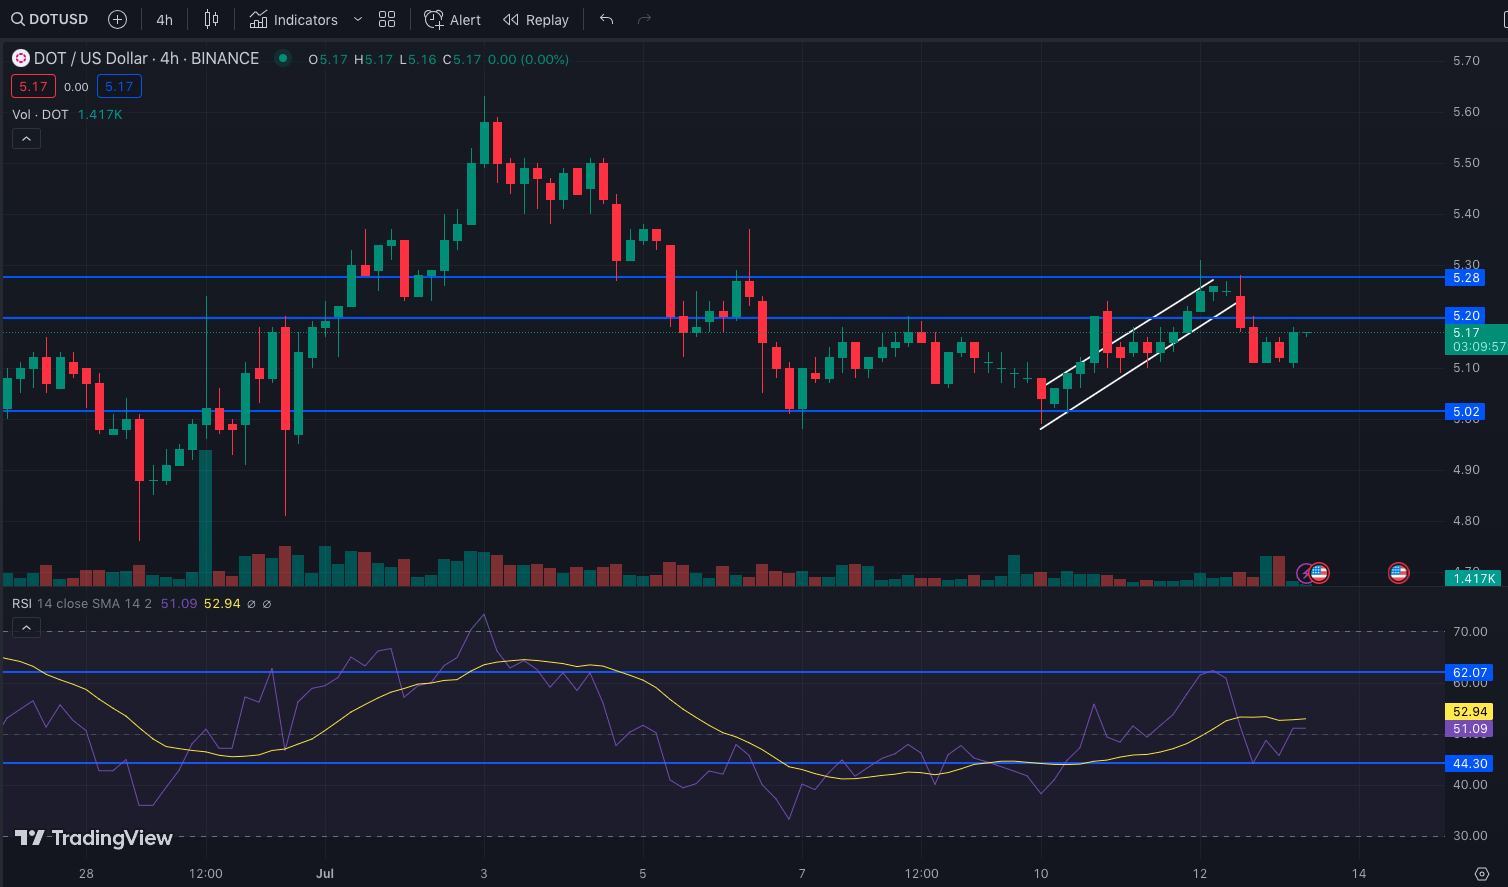
- DOT recovered its buying momentum after the RSI initially fell to 44.30.
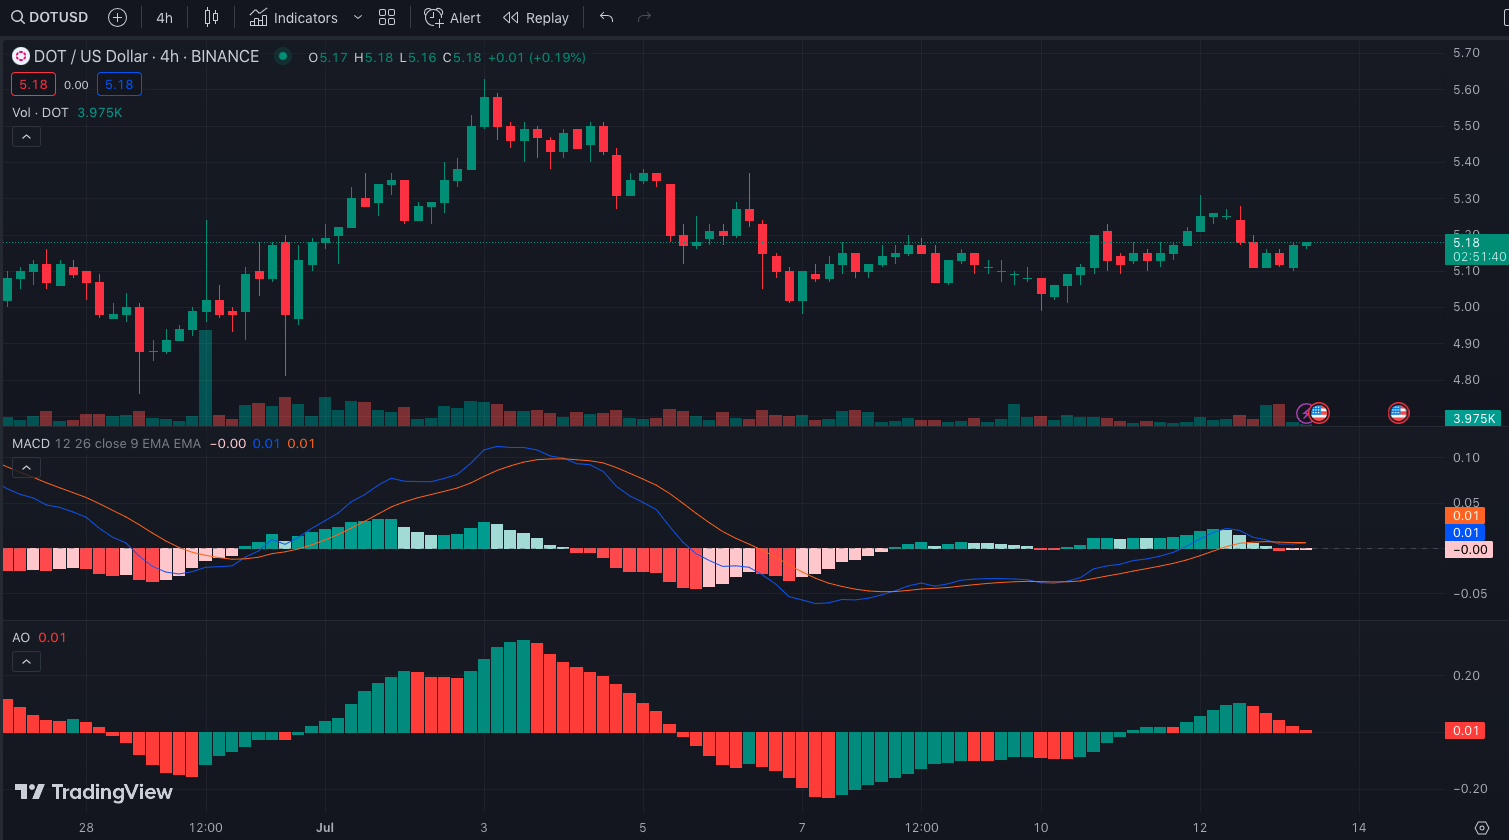
- Bears were becoming weak as DOT’s AO continually decreased.
- The MACD crossed from below zero, and increased demand could help it override $5.28.
Polkadot (DOT), after surging to a 30-day on July 3, retraced and has been unable to beat the $5.28 resistance. Also, the release of the U.S. Consumer Price Inflation (CPI) data has not done any good to change the DOT trend.
This was because the broader crypto market reaction, led by Bitcoin (BTC), was almost negligible. Regardless, DOT fell to an intraday low of $5.13.
Resurging Price Strength
According to the four-hour chart, DOT first faced the $5.28 resistance on July 6. But after a subsequent consolidation period, the market structure became bullish at $5.02 on July 10. The demand created at this point led the Relative Strength Index (RSI) to reach $62.07.
However, DOT could not go beyond this peak as selling pressure appeared. As a result, the token price slipped as the RSI also fell to 44.30.
As of this writing, the RSI was back up at 51.09. This showed that bulls had re-entered the market. But for DOT to approach another high, it will need to break the $5.20 ceiling. Also, the rising price strength has to improve beyond the 51.09 region.
However, it might be a little difficult to close in on another peak. This was due to the condition of the Moving Average Convergence Divergence (MACD). As of this writing, the MACD had converged the 0.00 centerline crossover.
DOT Needs to Cross the Centerline
This implies that there was almost no difference between the 12-period and 26-period EMAs. But the MACD turned up from below zero and a little above the histogram. This could be a primary buy signal.
If demand increases, an upside shift might weaken bears while DOT rises above $5.17. The Awesome Oscillator (AO) displayed consecutive lower red bars. This implies that bearish control was becoming weak.
Usually, a positive AO implies that the fast-moving average (5-period) is greater than the slow-moving average (34-period). On the other hand, a negative reading implies that the slow-moving average is greater than the fast-moving average.
So, like the MACD, the AO might require increased buying pressure for the 5-period Moving Average (MA) to exceed the 34-period MA. When this happens, then DOT could reform a bullish structure while taking sellers out of the way.
Presently, DOT may continue to linger in consolation. But in the event that the indicators align and break the $5.28 resistance, then DOT’s next target could go beyond $5.50.
Disclaimer: The views, opinions, and information shared in this price prediction are published in good faith. Readers must do their research and due diligence. Any action taken by the reader is strictly at their own risk. Coin Edition and its affiliates will not be liable for direct or indirect damage or loss.
Disclaimer: The information presented in this article is for informational and educational purposes only. The article does not constitute financial advice or advice of any kind. Coin Edition is not responsible for any losses incurred as a result of the utilization of content, products, or services mentioned. Readers are advised to exercise caution before taking any action related to the company.
 Price Prediction 2026-2030: Will LTC Hit $80 Soon?")


 Price Prediction 2026, 2027, 2028, 2029, 2030-2050")
