


 Falls Into Bear Trap, May Continue Evading $7")
- The demand for LINK at $6.77 was not enough to avoid a sharp drop in price.
- LINK formed a negative divergence, and a downward breakout could be on the horizon.
- The CMF needs to form a higher low, alongside a lower high price action to offer a buying opportunity.
Despite its prolonged struggles in the second quarter, Chainlink’s (LINK) performance in July has been relatively impressive. According to CoinMarketCap, LINK crossed $7 on July 14, thanks to a 10.17% 7-day price increase.
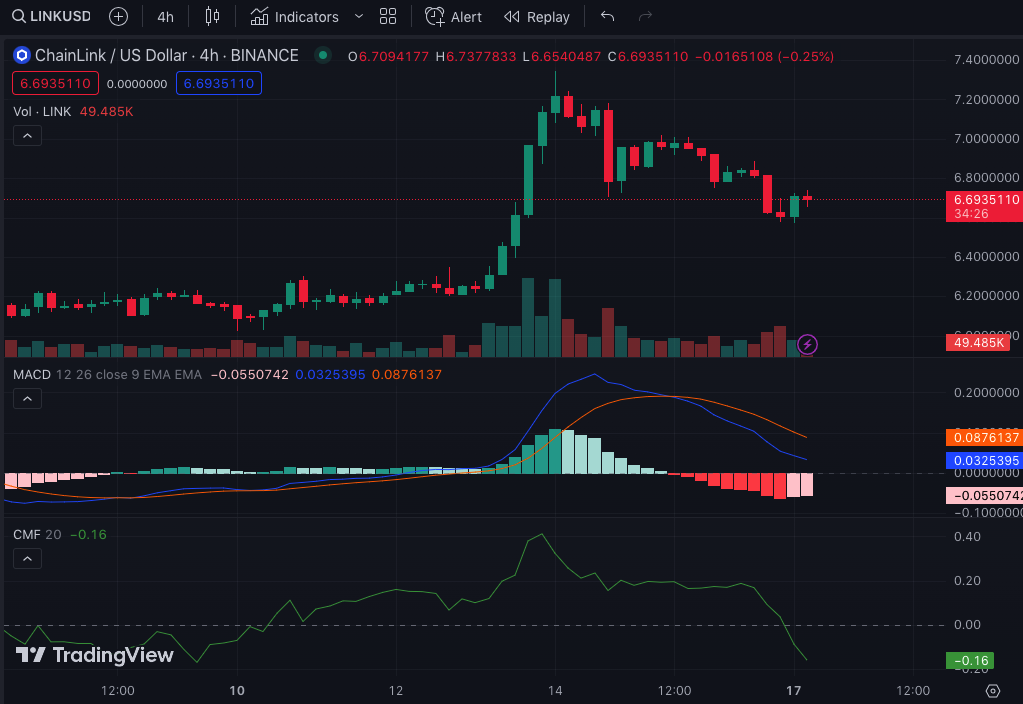
However, the token’s momentum has changed. As a result, LINK’s value fell to $6.68. One reason LINK decreased this much was the sharp rejection it faced at $7.17. On the LINK/USD 4-hour time frame, buyers made attempts to help the price recover.
Distribution Overtakes Accumulation
But the demand was not enough to outpace the numerous sell orders. Specifically, at $6.77, demand appeared again on 16 July. Unfortunately for bulls, the demand was not enough to override the resistance at $6.81 as LINK fell sharply to $6.66.
Furthermore, indications from the On-Balance-Volume (OBV) showed that LINK was going through a distribution phase. Also, LINK had formed a negative divergence since July 14 when the price peaked and the OBV failed to hit another high.
This failure resulted in a negative divergence and stalled the LINK price. So, a downward breakout could appear in the short term unless accumulation neutralizes it.
Also, the Relative Strength Index (RSI) trended southwards. At 48.13, the RSI showed signs of waning strength. If the trend continues, then it’s likely that LINK may drop below $6.50 soon.

LINK Buyers Need the CMF
Another rationale for a possible downward trajectory is the Moving Average Convergence Divergence (MACD). At the time of writing, the MACD was -0.055. Typically, the negative MACD implied that the 12-day EMA was below the 26-day EMA.
The MACD position aligns with the notion that the downward trend had gained strength. So, traders might need to overlook buying at $6.68.
Also, the orange dynamic line had risen above the blue dynamic line. An interpretation of this stance suggests that sellers’ dominance outweighed buyers.
Like the MACD, the Chaikin Money Flow (CMF) also turned downwards. At press time, the CMF was -0.17. The indicator’s move into the negative territory suggests that LINK’s buying and selling pressure was not equal. Instead, the CMF favored the bears.
So, for traders to confirm a buy signal, the CMF needs to diverge with a higher low, and this has to follow the price action fall into an oversold region. If the price action does not follow the trend, then LINK may again, decrease.
Disclaimer: The views, opinions, and information shared in this price prediction are published in good faith. Readers must do their research and due diligence. Any action taken by the reader is strictly at their own risk. Coin Edition and its affiliates will not be liable for direct or indirect damage or loss
Disclaimer: The information presented in this article is for informational and educational purposes only. The article does not constitute financial advice or advice of any kind. Coin Edition is not responsible for any losses incurred as a result of the utilization of content, products, or services mentioned. Readers are advised to exercise caution before taking any action related to the company.
 Price Prediction: Can BTW Sustain Its Breakout Above $0.1032?")


