


 Bounce to the Top Cools Off; Will It Recover?")
- LINK fell from its two-week high following Bitcoins’ drop below $30,000.
- If whales continue to accumulate, then LINK may exchange hands between $7.9 and $8.5.
- Sellers had some presence, indicating a potential for LINK to fall below $7.40.
Chainlink (LINK) climbed as high as $7.85 on August 9, following Bitcoin’s (BTC) mild recovery to $30,000. For a token that almost lost its hold on $7, LINK’s price increase confirmed the notion that buyers had forced the 6.47% 7-day hike.
However, the increase has cooled off as BTC also struck out its recent gains. At press time, LINK was trading at $7.55, losing 0.59% of its value in the last 24 hours.
On the 4-hour chart, LINK’s climb was triggered by bulls’ resolve to create demand at $7.07 on August 6. This buying pressure ensured that LINK’s market structure was bullish as the price ascended.
Profit-taking Leads LINK Down
But after rising as high as $7.85, SHIB met resistance at $7.74. Bulls made further attempts to push towards $8 but on several, occasions, faced rejection around the same resistance area.
As a result of the increase, the Relative Strength Index (RSI) rose as high as 71.10. But the RSI rising above 70 indicates that LINK was overbought. Consequently, the indicator affected the price decline as the RSI itself fell to 54.07.
The decline also suggests profit-taking. Therefore, it is possible that LINK drops below $7.40 if selling pressure continues. On the other hand, if whale accumulation continues, LINK’s next target could be between $7.9 and $8.5.
As of this writing, the +DMI (green) was still above the -DMI (red) at 22.71 to 13.36 respectively. The difference indicates that buyers’ authority had waned a bit. But sellers were not exactly in control.
Furthermore, the Average Directional Index (DMI) was 32.64. This signals a strong directional movement. For LINK to rise as high as $8, the +DMI needs to revert to the upward trajectory since the ADX (yellow) supports a solid direction.

$7.40 Could Be a Good Entry
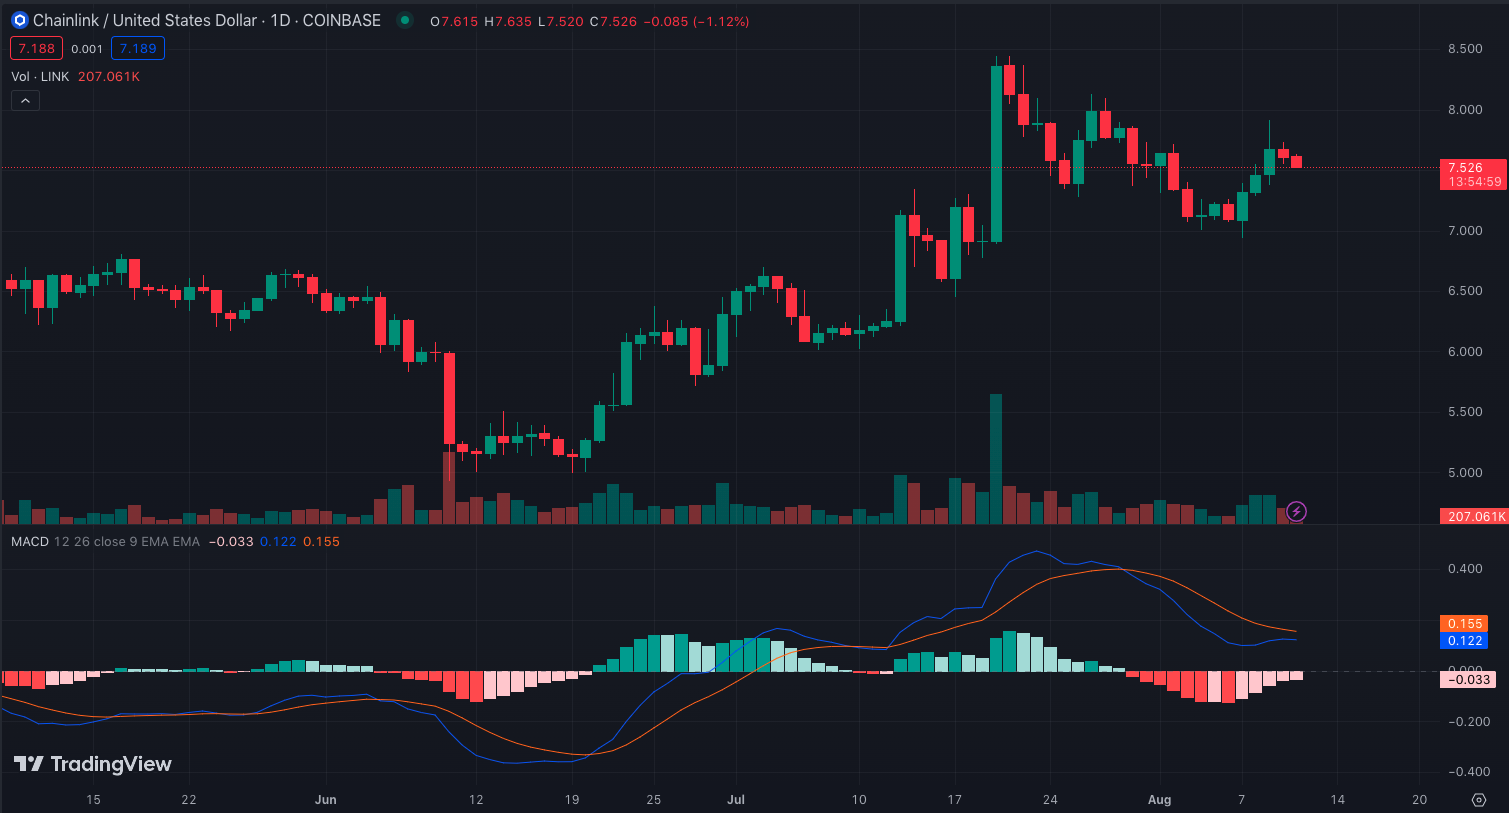
As per the Moving Average Convergence Divergence (MACD), the daily chart showed that the indicator was negative. Negative values of the MACD imply that the 12-day EMA diverged below further below the 26-day EMA.
This means that the downward momentum is increasing. So, unless the MACD switches the momentum to positive, and the orange dynamic line fall below the blue line, LINK might decrease further.
However, if LINK continues to fall, it does not negate the possibility of recovery. If the token hits $7.40, it could be a good entry for traders looking to long LINK.
Disclaimer: The views, opinions, and information shared in this price prediction are published in good faith. Readers must do their research and due diligence. Any action taken by the reader is strictly at their own risk. Coin Edition and its affiliates will not be liable for direct or indirect damage or loss.
Disclaimer: The information presented in this article is for informational and educational purposes only. The article does not constitute financial advice or advice of any kind. Coin Edition is not responsible for any losses incurred as a result of the utilization of content, products, or services mentioned. Readers are advised to exercise caution before taking any action related to the company.


