


- Cosmos price analysis indicates a bearish market sentiment.
- ATOM/USD pair is currently testing horizontal support at $14.00.
- The market may see some consolidation before the next move.
Cosmos (ATOM) has had a tough start to the week, plunging to lows of $14.34 after a bearish start to the week. The market has struggled to find any real momentum over the past few days, and Cosmos has been caught up in the wider market sell-off.
The market is currently testing horizontal support at $14.00 and if this level breaks, Cosmos could retest the previous lows of $13.50. The market may see some consolidation before the next move as the RSI remains in oversold territory.
Cosmos price analysis for the ATOM/USD pair shows that the market is currently trading at horizontal support at $14.00. If this level breaks, Cosmos could retest the previous lows of $13.50. The current support levels are $14.00 and $13.50 while the resistance levels are $15.00 and $15.50.
The ATOM/USD trading price is currently below the 200-day moving average while the MACD is bearish and below the zero line. The RSI is currently in oversold territory, but there is no clear trend at this moment. The market may see some consolidation before the next move, as the overall market sentiment remains bearish.
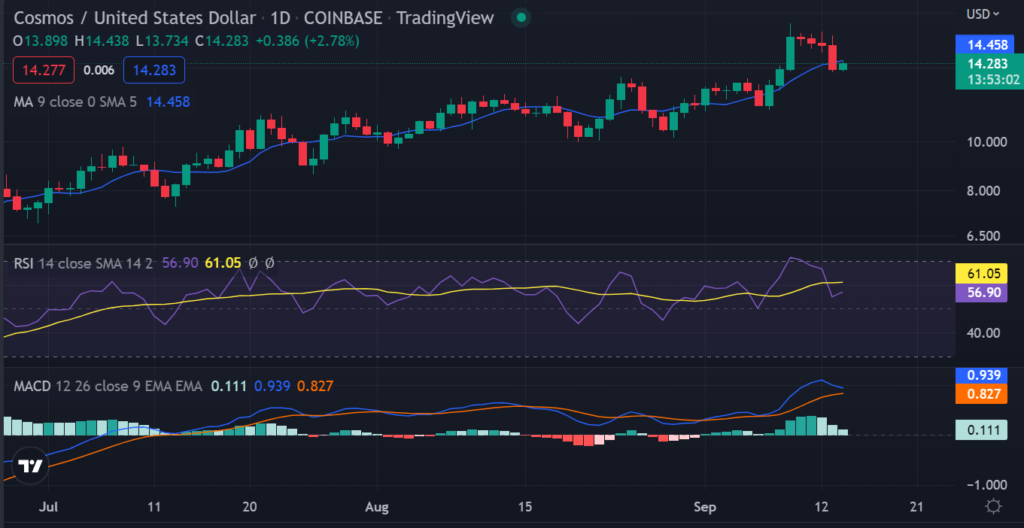
The Relative Strength Index (RSI) is currently at 31.33, which indicates that the market is oversold. The market is expected to remain bearish in the short term with a possible retest of the $13.50 support level. In the longer term, however, Cosmos could see some gains as the market looks to rebound from the recent sell-off.
Cosmos price analysis on the 4-hourly chart indicates the bears have increased their grip on ATOM prices as the digital asset has been on a continuous decline.
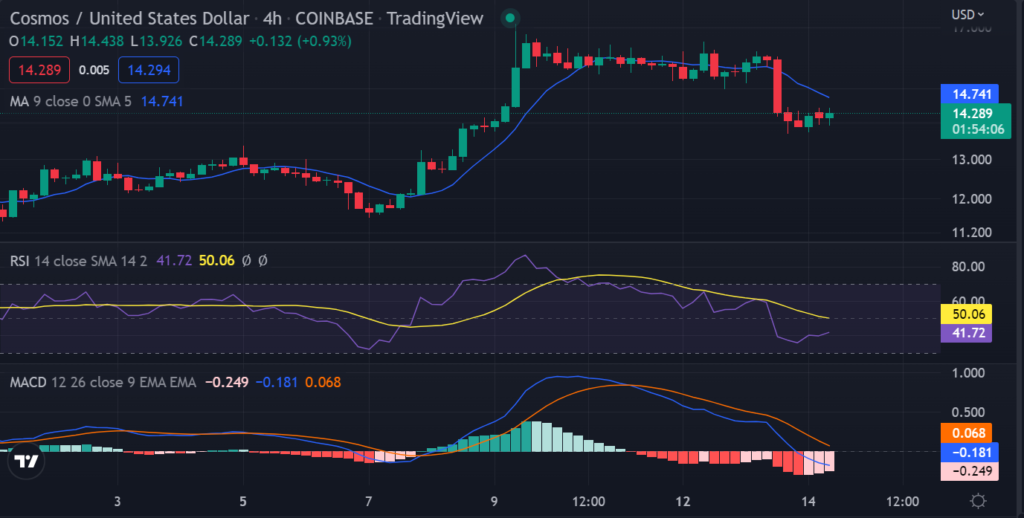
On the 4-hourly chart, ATOM/USD is currently in a continuous declining trendline. Cosmos dipped to as low as $13.09 during the opening hours of the day and has since bounced back to $14.34.
The technical indicators on the 4-hour chart are all signaling a bearish market sentiment. The MACD is currently in a bearish trend and is below the zero line, while the RSI is also in oversold territory. The market may see some consolidation before the next move as the overall market sentiment remains bearish.
To sum up, the ATOM/USD pair is currently in a bearish trend and is expected to continue to struggle in the short term. In the longer term, however, Cosmos could see some gains as the market looks to rebound from the recent sell-off.
Disclaimer: The information presented in this article is for informational and educational purposes only. The article does not constitute financial advice or advice of any kind. Coin Edition is not responsible for any losses incurred as a result of the utilization of content, products, or services mentioned. Readers are advised to exercise caution before taking any action related to the company.


