


 Take Advantage of Curve Finance’s (CRV) Fall?")
- Since the Curve pool was breached, Uniswap’s DEX volume increased.
- UNI could rise above $6.50 if the buying momentum continues to increase.
- Selling pressure continues to dominate on the CRV/USD chart, leaving the token at risk of further decline.
The Decentralized Exchange (DEX) landscape has been witnessing intense challenges and recent market developments have brought Curve Finance (CRV) into the spotlight. As one of the leading DEX platforms, Curve Finance gained traction, but for the wrong reasons after its liquidity pool suffered an exploit.
Following the unfortunate incident, the CRV price tanked by 10.24% in the last 24 hours. But as it stands, the problems of Curve could give rise to an extended dominance for Uniswap (UNI) since it was a strong competitor of Curve.
Uniswap Enlarges Its Coast
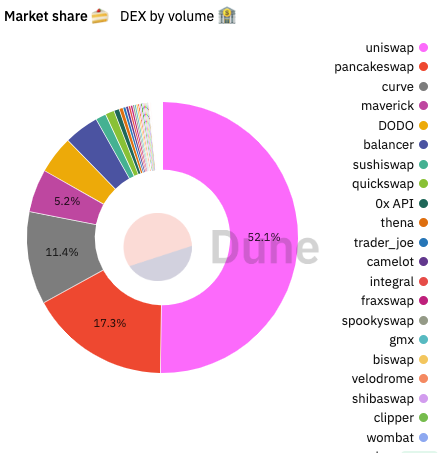
With respect to the UNI token, CoinMarketCap showed that it hovered around $6.44. But when it comes to its fundamentals, Dune Analytics, showed that the 24-hour DEX volume was $20.7 billion.
However, out of the entire volume, Uniswap accounted for 52.1% share. The share of Curve Finance was 11.2% valued at $257.77 million. The difference in volume showed how Uniswap has extended its dominance over Curve, indicating a higher exchange on the Uniswap liquidity pool over the Curve pool.
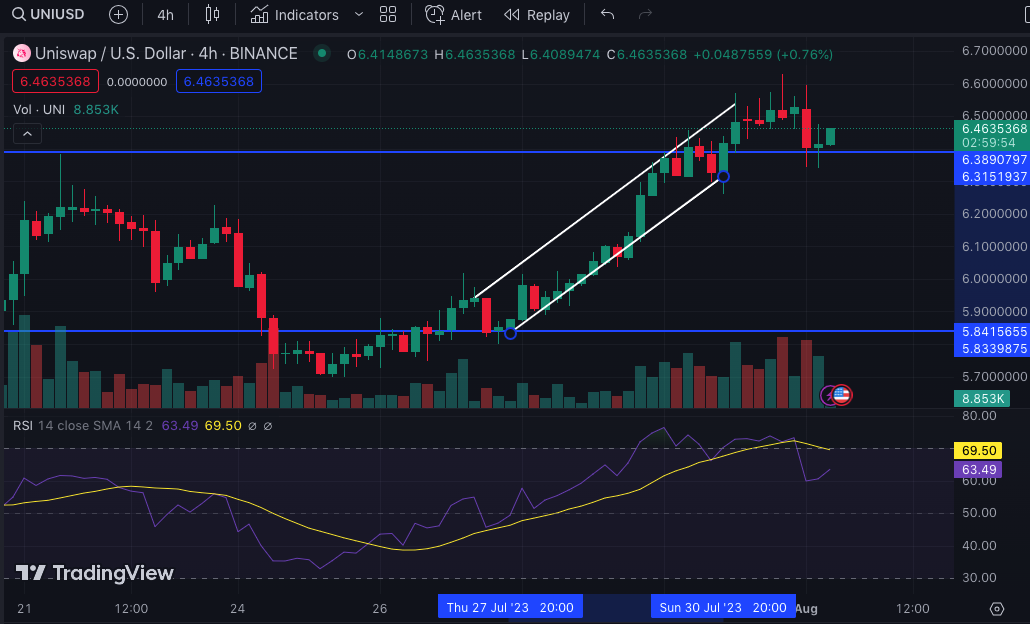
Based on the price action, the UNI/USD 4-hour chart market structure was bullish. On July 25, bulls created demand at $5.84. Interestingly, the buying pressure increased such that UNI hit $6.38 on July 30.
CRV Dips, UNI Could Rise
But since then, UNI has been unable to sustain the uptrend due to inconsistencies in buy and sell orders. Despite the retracement from its highs, the Relative Strength Index (RSI) was 63.49. This indicates good buying momentum.
Consequently, the buying momentum could have played a part in UNI’s recovery to $6.44. If the RSI pushes further upward, then UNI could hit $6.50. But traders may need to watch out for the RSI hitting 70 or above. If the indicator hits 70, the UNI would be said to be overbought. Hence, the price could fall.
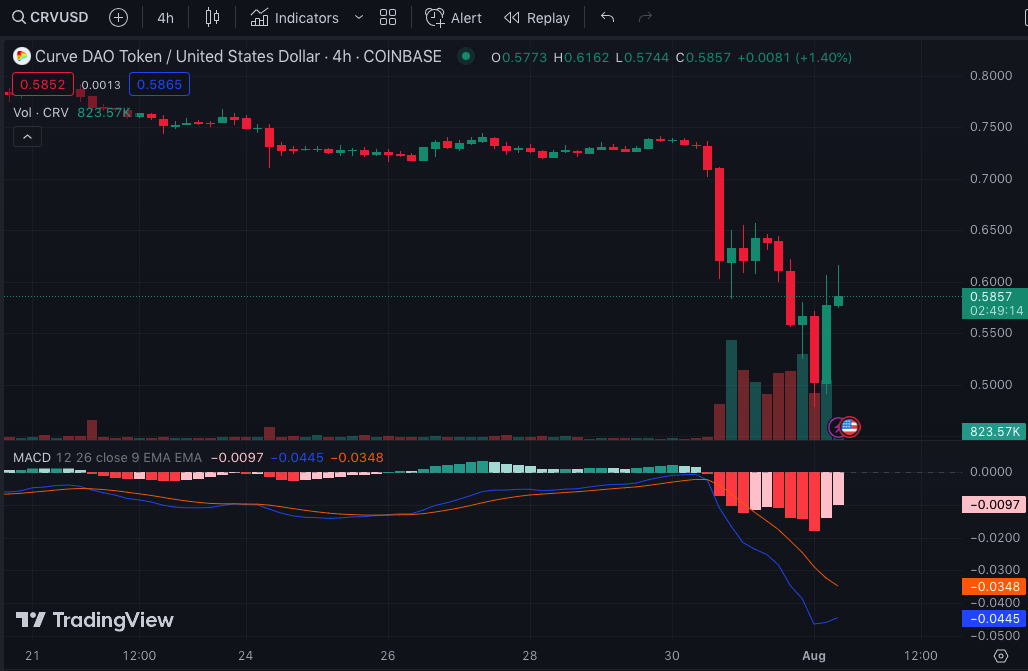
For CRV, it may not exit its bleak state anytime soon. According to the CRV/USD 4-hour chart, there were numerous sell candles since July 31. However, there have been some large buys as CRV recovered to $0.59.
Nonetheless, the Moving Average Convergence Divergence (MACD) WAS -0.0093. Furthermore, the orange dynamic line was above the blue dynamic line. This suggests that sellers were still in control of the market despite some buying pressure.
The decrease in the MACD indicates increasing downward momentum as the 12-day EMA diverged below the 26-day EMA.
In short, CRV might need more than the current buying momentum to evade the claws of bears. Then again, UNI has the tendency to rise above $6.50.
Disclaimer: The views, opinions, and information shared in this price prediction are published in good faith. Readers must do their research and due diligence. Any action taken by the reader is strictly at their own risk. Coin Edition and its affiliates will not be liable for direct or indirect damage or loss.
Disclaimer: The information presented in this article is for informational and educational purposes only. The article does not constitute financial advice or advice of any kind. Coin Edition is not responsible for any losses incurred as a result of the utilization of content, products, or services mentioned. Readers are advised to exercise caution before taking any action related to the company.
 Price Prediction 2026, 2027, 2028, 2029, 2030 -2050")


