


- Santiment tweeted yesterday that CRV, COMP, IMX, AAVE and YGG recorded spikes in whale activity recently.
- Technical indicators suggested that CRV, IMX, COMP and AAVE may see their prices break out soon.
- Meanwhile, YGG was at risk of bringing an end to its positive medium-term trend.
The blockchain intelligence platform Santiment revealed in a tweet yesterday that whale activity has spiked during the past 48 hours – impacting the prices of several altcoins in the market. According to the post, a number of altcoins including AAVE, COMP, CRV, IMX and YGG recorded transfers of more than $10 million.
Despite varying price performances for these altcoins during the past 24 hours, chart patterns and technical indicators for all 5 of the cryptocurrencies suggested that strong price movements may ensue in the coming 2 weeks. Most notably, CRV showed the most potential for a strong medium-term breakout in the next few days.
Aave (AAVE)
At press time, CoinMarketCap indicated that AAVE was changing hands at $57.68. This was after it was able to achieve a 24-hour gain of 0.95%. Moreover, the positive daily performance was a continuation of the bullish momentum that had been established for AAVE over the past week. Subsequently, the cryptocurrency’s price was up 4.81% over the past 7 days.
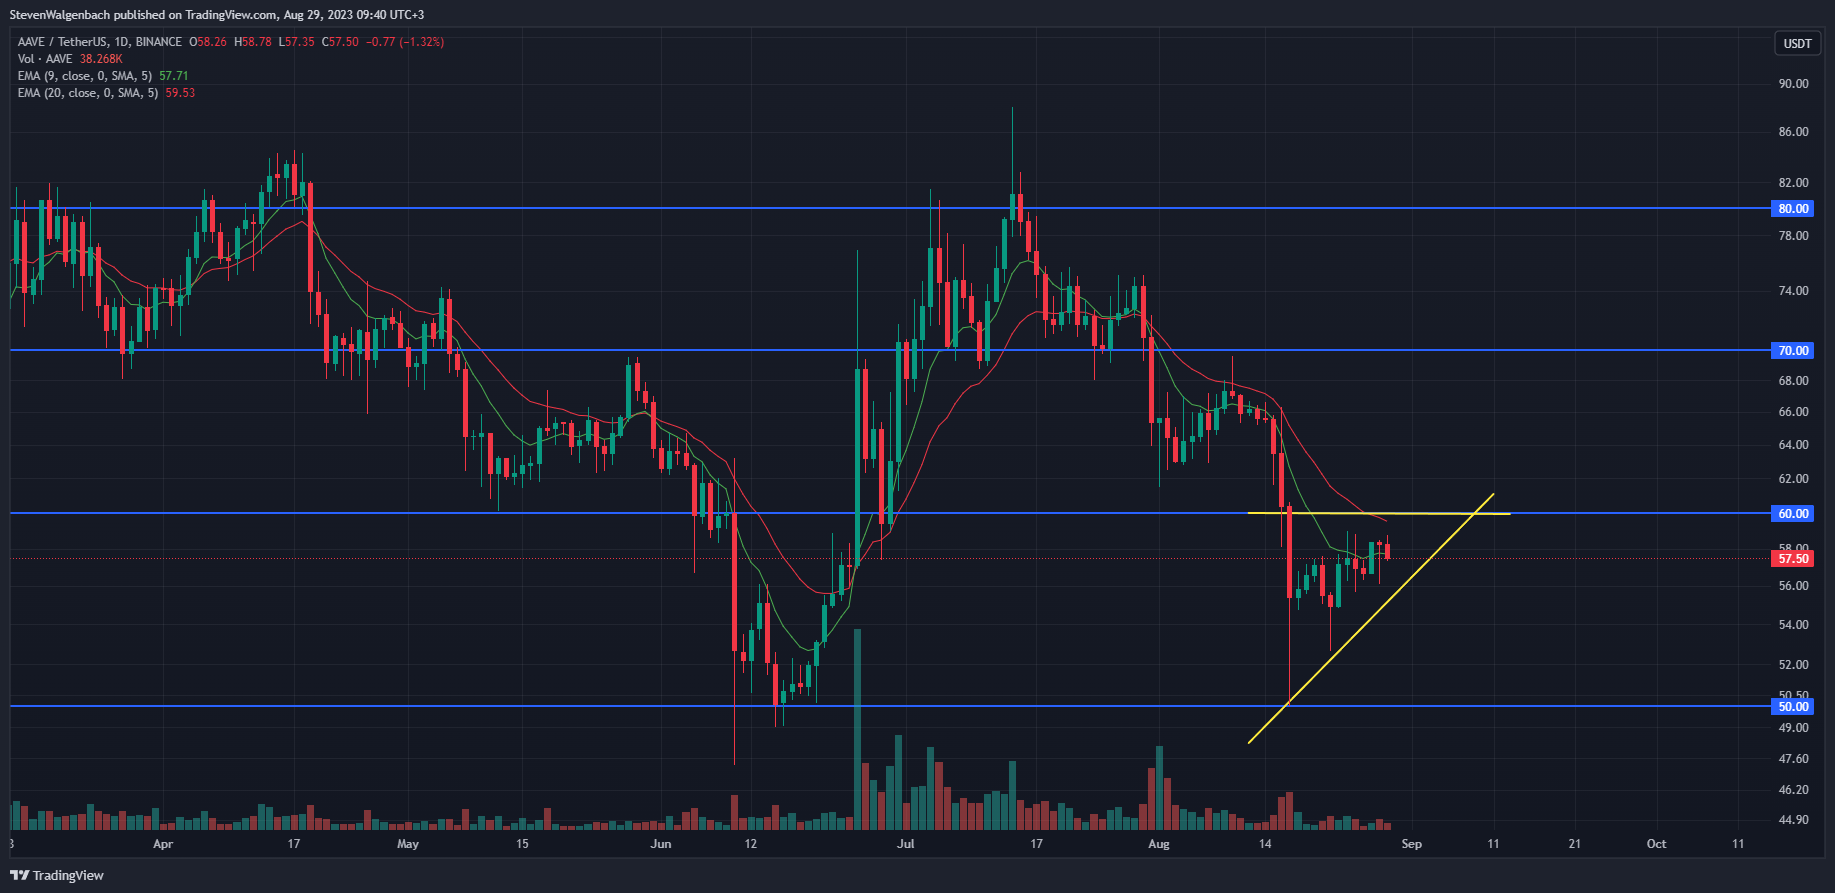
A bullish ascending triangle pattern had formed on AAVE’s daily chart after the altcoin consistently printed higher lows during the past week. If this pattern is validated, AAVE could attempt to flip the resistance level at $60 into support within the coming few days.
Thereafter, the cryptocurrency’s price will have a relatively clear path to rise to the next significant barrier at $70 within the following 2 weeks. Investors and traders will also want to keep an eye on the 9-day and 20-day EMA lines on AAVE’s chart, as these 2 technical indicators were looking to cross as well.
If these 2 EMA lines do cross, it will signal a bullish change in short-term momentum which may result in AAVE’s price potentially flipping the $70 resistance level into support within the next few weeks. This bullish thesis will be invalidated if AAVE’s price breaks below the positive trendline on its daily chart. In this scenario, AAVE will be at risk of retesting the $50 support.
Compound (COMP)
COMP was unable to benefit from the increased volatility on its network, and had suffered a 24-hour loss of 0.60%. As a result, COMP’s price stood at $41.21 at press time. Along with the decrease in price, the altcoin also experienced a 3.97% decline in its daily trading volume. This latest drop in volume brought the total down to approximately $19.8 million.
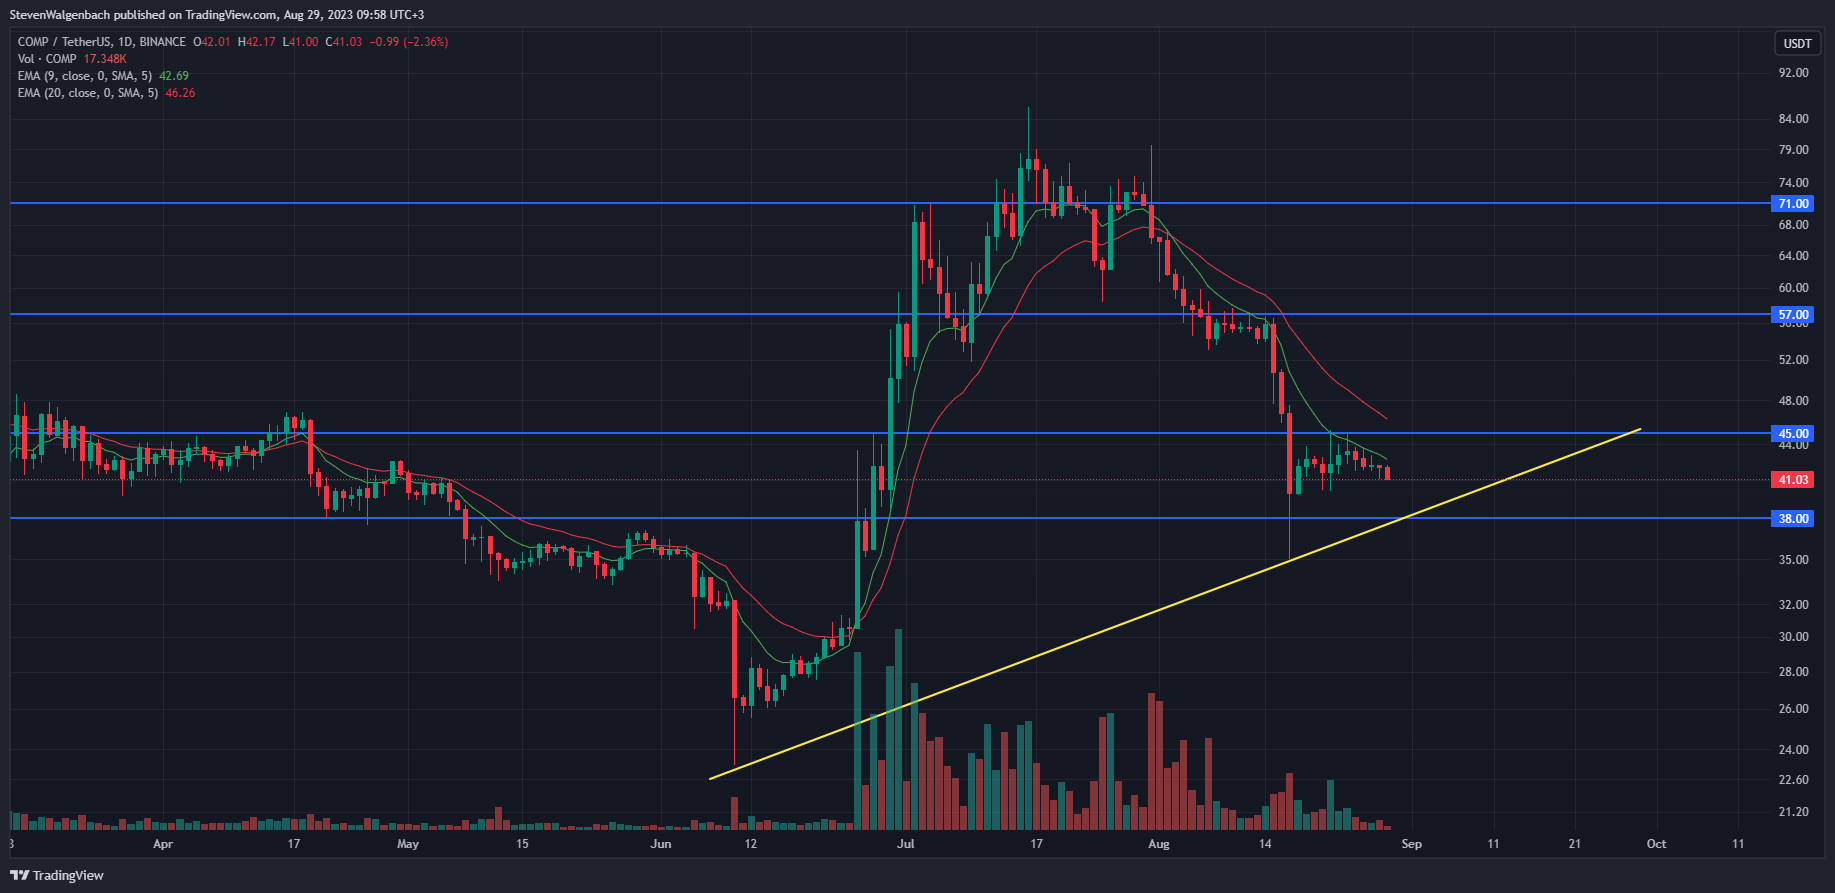
A medium-term positive trend line was present on COMP’s daily chart after the cryptocurrency printed a second higher low on 17 August 2023. If this positive trend continues, COMP’s price may break above the $45 and $57 resistance levels in the coming couple of weeks. This could then also lead to the altcoin’s price challenging the $71 barrier as well.
An early confirmation of this bullish thesis will be when COMP’s price closes 2 consecutive daily candles above the 9-day and 20-day EMA lines. If the cryptocurrency succeeds in closing above these 2 technical indicators, then short-term momentum may shift in favor of bulls, which will lead to COMP’s price continuing to rise in the following few days.
On the other hand, if COMP’s price fails to break above the 9-day EMA line before the end of this week, then it could be at risk of testing the crucial support level at $38. A break below this level will also bring an end to its medium-term positive trend, as the altcoin’s price will also lose the support of the trend line that had formed on its daily chart.
Curve DAO Token (CRV)
CRV took the lead in terms of price performance throughout the past day of trading. According to CoinMarketCap, the altcoin’s price was able to post a 24-hour increase of 3.97%. Subsequently, CRV was trading hands at $0.481 at press time. Most notably, the cryptocurrency’s 24-hour trading volume surged by more than 100% as well.
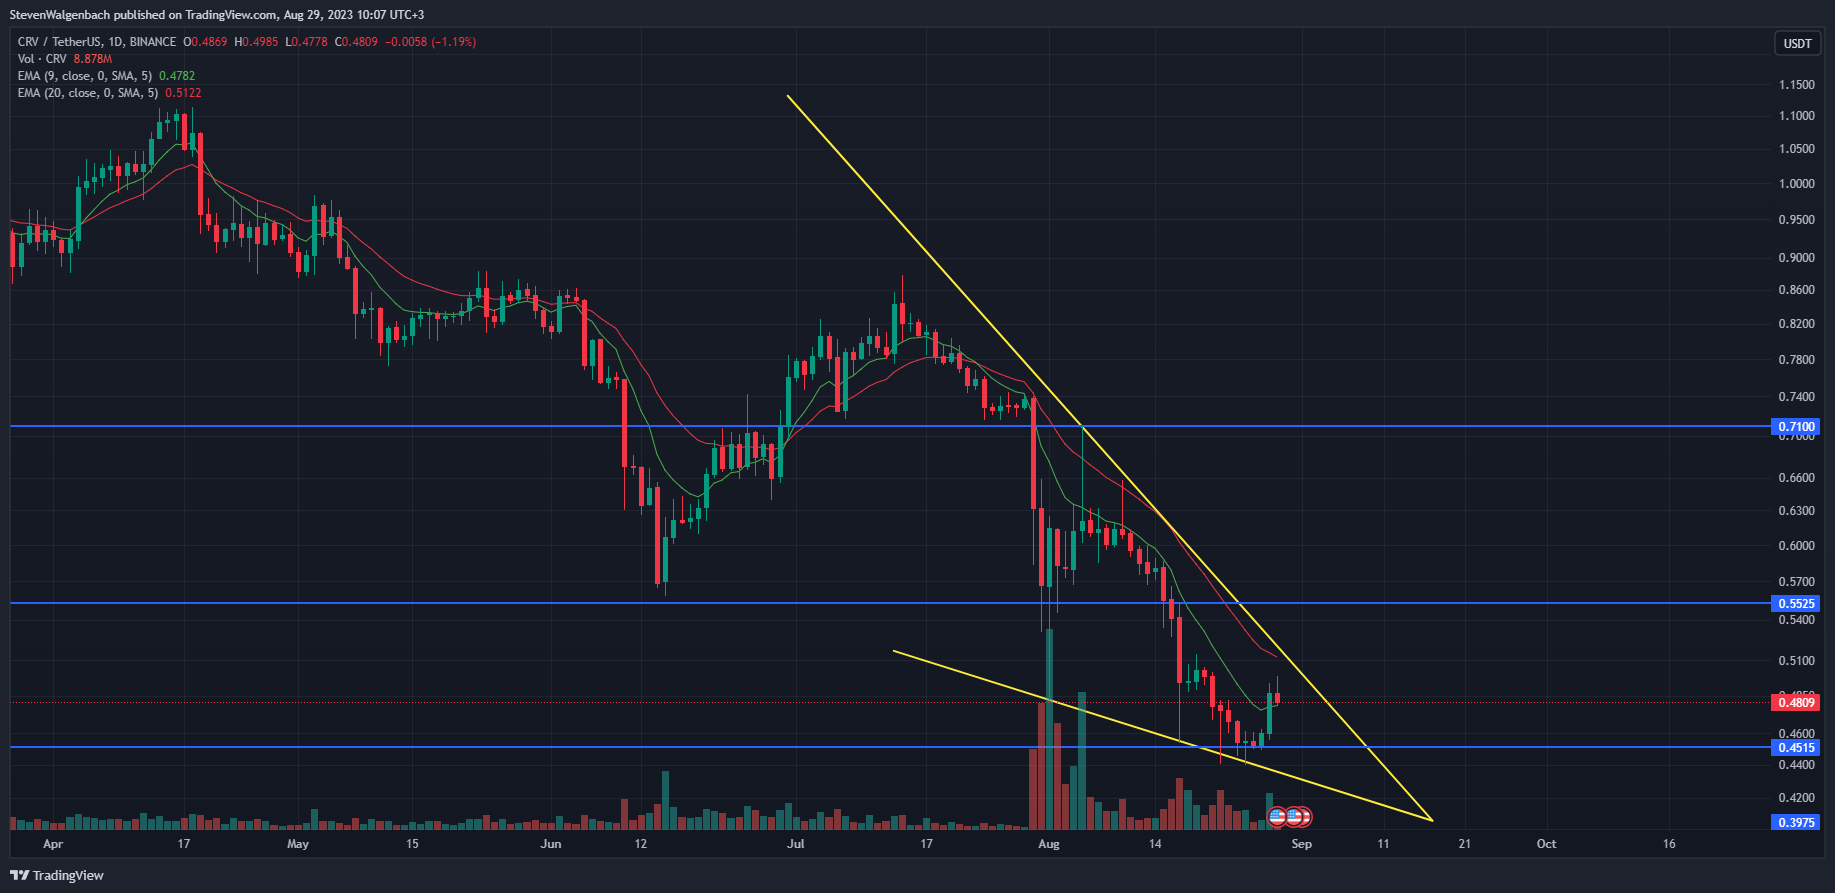
CRV’s price may be poised for a bullish breakout soon given the fact that a falling wedge chart pattern had formed on its daily chart over the past couple of weeks. If this pattern is validated, the altcoin’s price may flip the $0.5525 resistance into support before beginning a strong ascent towards the next major price point at $0.71.
A potentially early indication of this bullish thesis will be when CRV’s price breaks above the 20-day EMA line at around $0.5122. Thereafter, risk-savvy traders may want to wait for a daily candle close above $0.5525 before entering into a long position for CRV.
However, if CRV’s price is rejected by the 20-day EMA line in the coming few days, then it may seek support from the 9-day EMA line in the following 48 hours. Thereafter, CRV will either begin to climb or break below the technical indicator to retest the crucial support level at $0.4515. Either way, technical indicators suggest that CRV is poised for a breakout soon.
Immutable (IMX)
IMX printed a slight 0.07% gain throughout the previous 24 hours – boosting its price to $0.561 as a result. Despite the slight increase in price, the cryptocurrency was trading closer to its 24-hour low of $0.5569, while its peak for the same period stood at $0.5747.
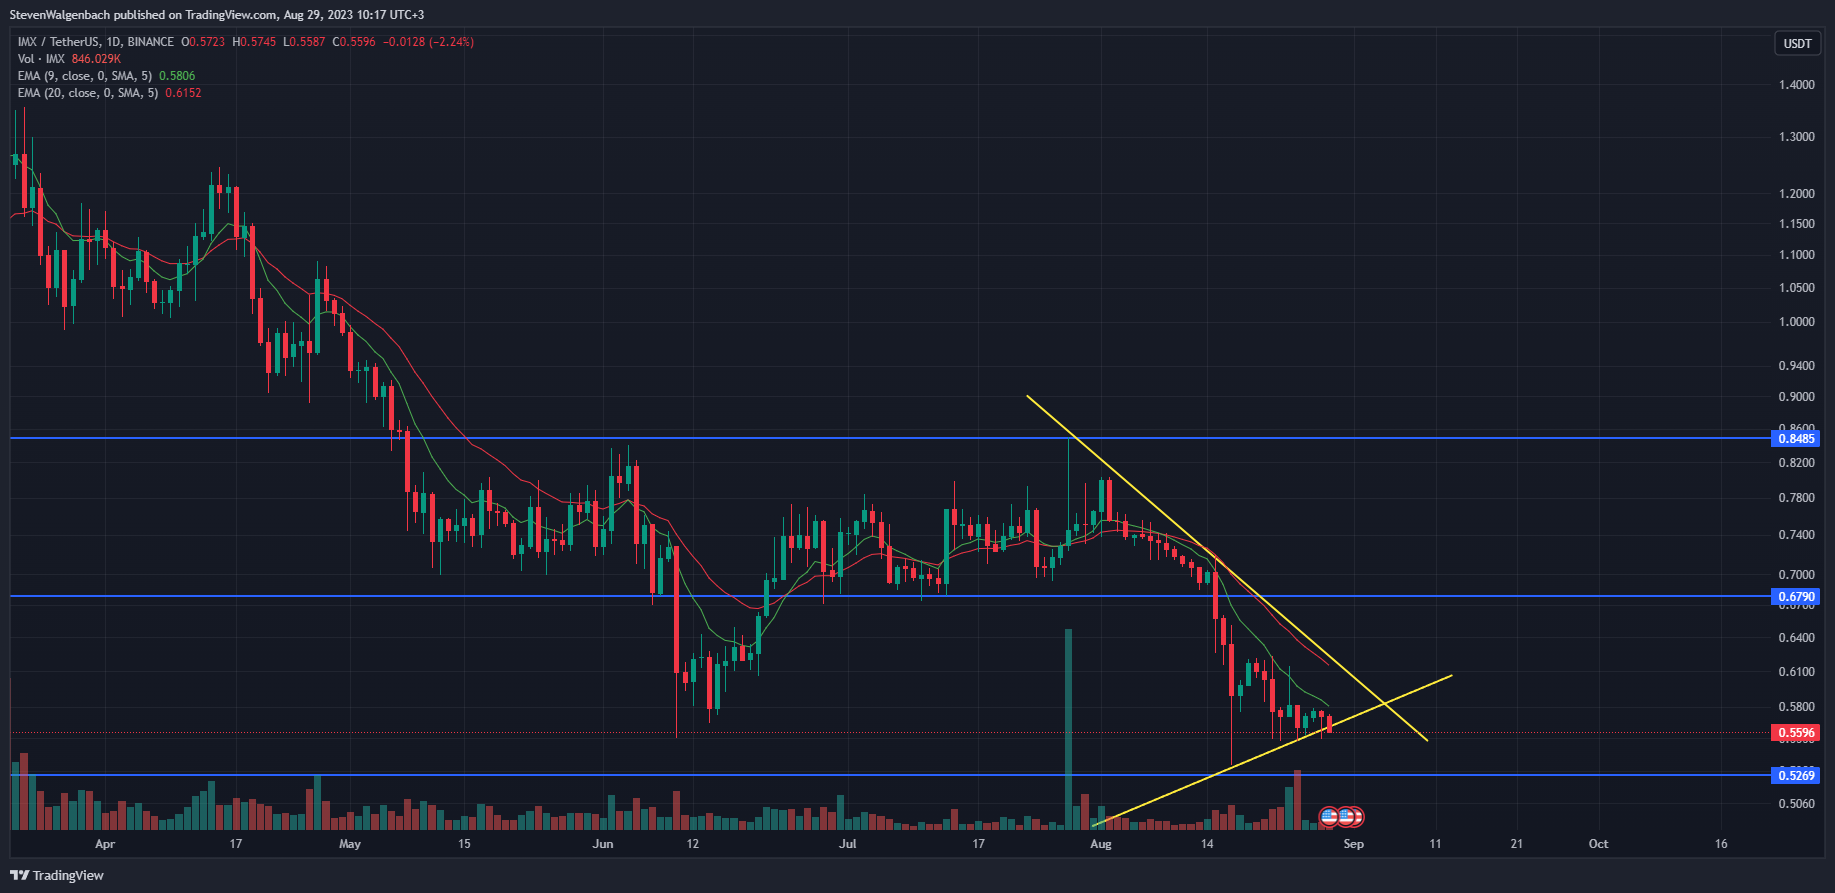
A symmetrical triangle pattern had formed on IMX’s daily chart, which suggested that a price breakout was imminent. If this pattern leads to a positive move, then IMX’s price could rise to the $0.6790 resistance level within the next week. Thereafter, continued buy pressure may enable the altcoin to flip the $0.6790 resistance into support – opening up a path to $0.8485.
Conversely, a bearish breakout may result in the cryptocurrency’s price testing the next major support level at $0.5269 in the following few days. Technical indicators favored a bearish outlook at press time, as the 9-day EMA line was positioned below the 20-day EMA line.
This indicated that sellers had the upper hand at press time. Nevertheless, IMX’s price may still breakout towards the upside if it is able to close a daily candle above the 20-day EMA line at around $0.6153 within the next 72 hours.
Yield Guild Games (YGG)
YGG was another altcoin that saw its price drop during the past 24-hour cycle, and was down 0.65% at press time. Subsequently, the altcoin was valued at $0.208 per coin at press time. This fresh decline in price had pushed YGG’s weekly performance further into the red zone to -7.67% as well.
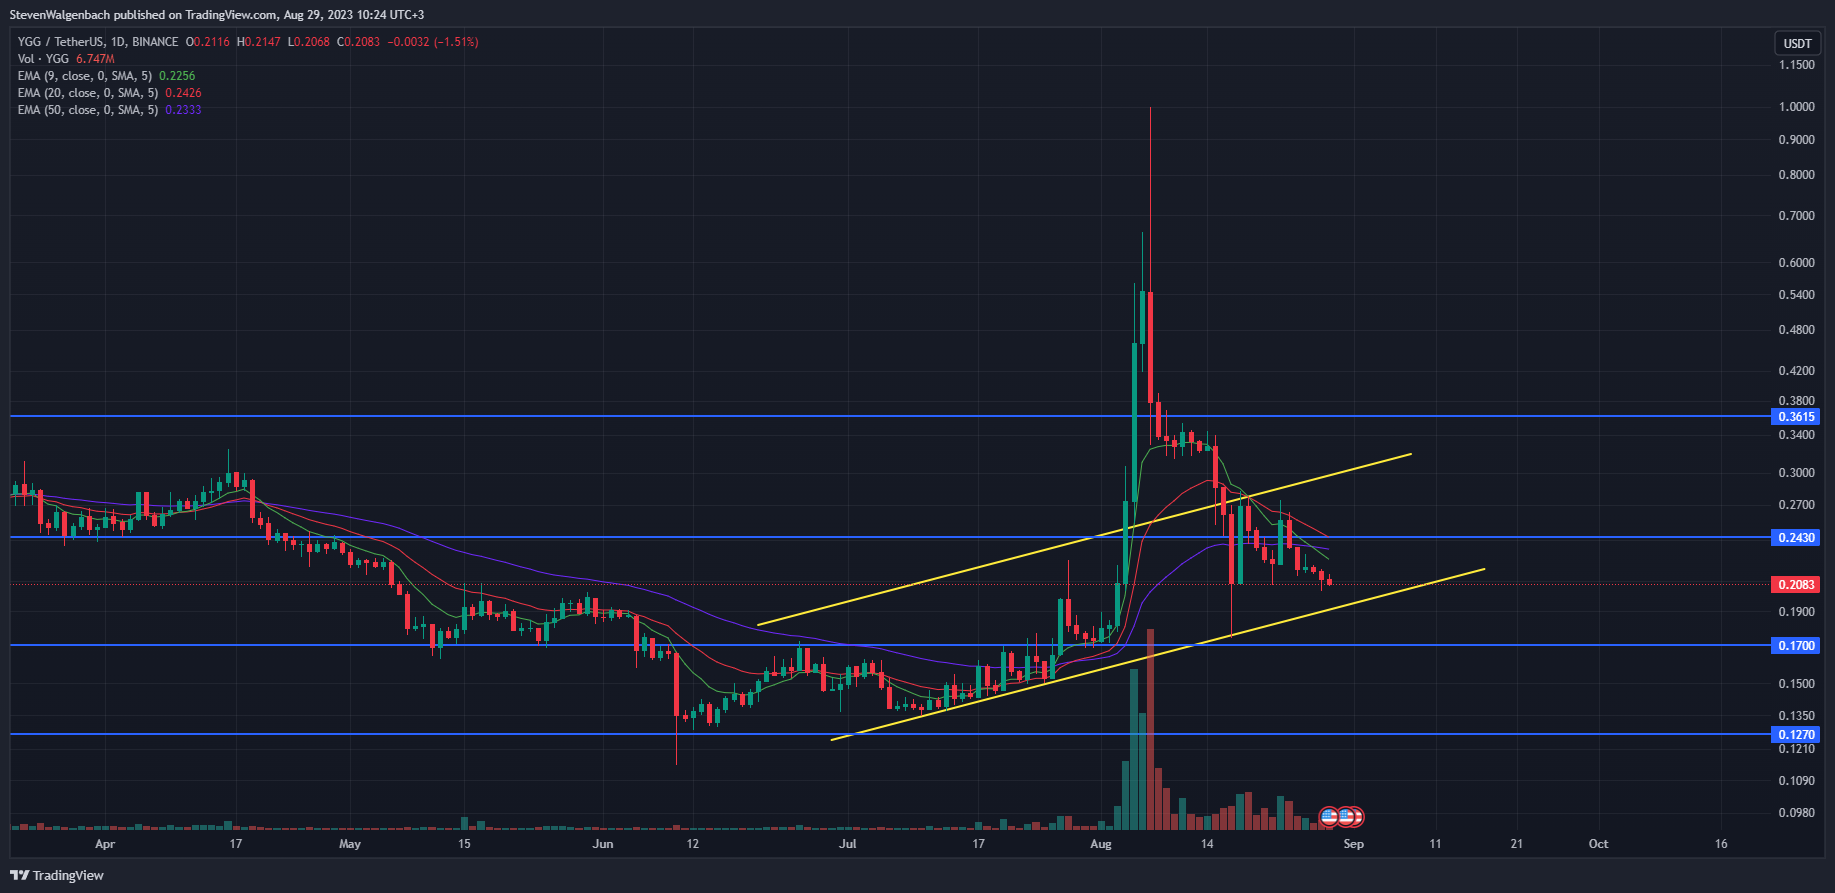
YGG had been in a positive trend over the past few weeks. During this time, the cryptocurrency’s price had consistently printed higher lows and higher highs, resulting in the formation of a positive price channel as well.
A recent technical flag that triggered suggested, that this positive trend may be coming to an end. During the past 72 hours, the 9-day EMA line crossed below the 50-day EMA line. This indicated that medium-term momentum may begin to shift in favor of sellers. This will be confirmed when the 20-day EMA line crosses below the 50-day EMA line.
If this bearish technical flag is validated, then YGG’s price could retest the crucial support level at $0.1700 in the coming week. Overwhelming sell pressure may also result in YGG’s price breaking below this support level to the next key mark at $0.1270.
On the other hand, if YGG’s price is able to close a daily candle above the $0.2430 resistance level then the bearish thesis will be invalidated. In this scenario, the altcoin’s price may attempt a challenge at the next significant resistance level at $0.3615.
Disclaimer: The views and opinions, as well as all the information shared in this price analysis, are published in good faith. Readers must do their own research and due diligence. Any action taken by the reader is strictly at their own risk. Coin Edition and its affiliates will not be held liable for any direct or indirect damage or loss.
Disclaimer: The information presented in this article is for informational and educational purposes only. The article does not constitute financial advice or advice of any kind. Coin Edition is not responsible for any losses incurred as a result of the utilization of content, products, or services mentioned. Readers are advised to exercise caution before taking any action related to the company.
 Price Prediction 2026-2030: Will TRX Hit $0.50 Soon?")
 Price Prediction 2026-2050: Will HYPE Hit $100 Soon?")


: What Happens If You Use an Unlicensed Platform?")