
- ATOM rebounds from lows, maintaining positive momentum and staying above $7.20.
- Increased market cap and trading volume show growing investor enthusiasm for ATOM’s potential.
- Indicators suggest ATOM’s uptrend is weakening, urging caution for a possible downturn.
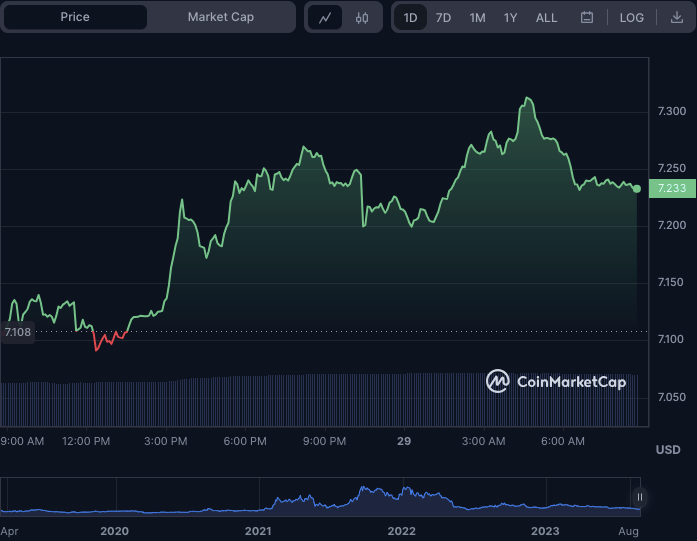
Despite an early bear grip that hit a 24-hour bottom of $7.09, almost exceeding the monthly low of $7.07, positive momentum has prevailed in the Cosmos (ATOM) in the previous 24 hours. Buyers stepped in to take advantage of the low prices, and the market swiftly recovered.
Consequently, the price rose steadily throughout the day, peaking at $7.31 before encountering some resistance. However, the general positive attitude remained strong, and the price stayed above the $7.20 barrier at press time, trading at $7.23.
ATOM’s market capitalization and 24-hour trading volume climbed by 1.82% and 19.33%, to $2,507,379,032 and $73,105,729, respectively, showing greater investor interest and activity in the cryptocurrency. This increase in market capitalization and trading volume indicates a rising interest in ATOM’s potential and capacity to attract investors.
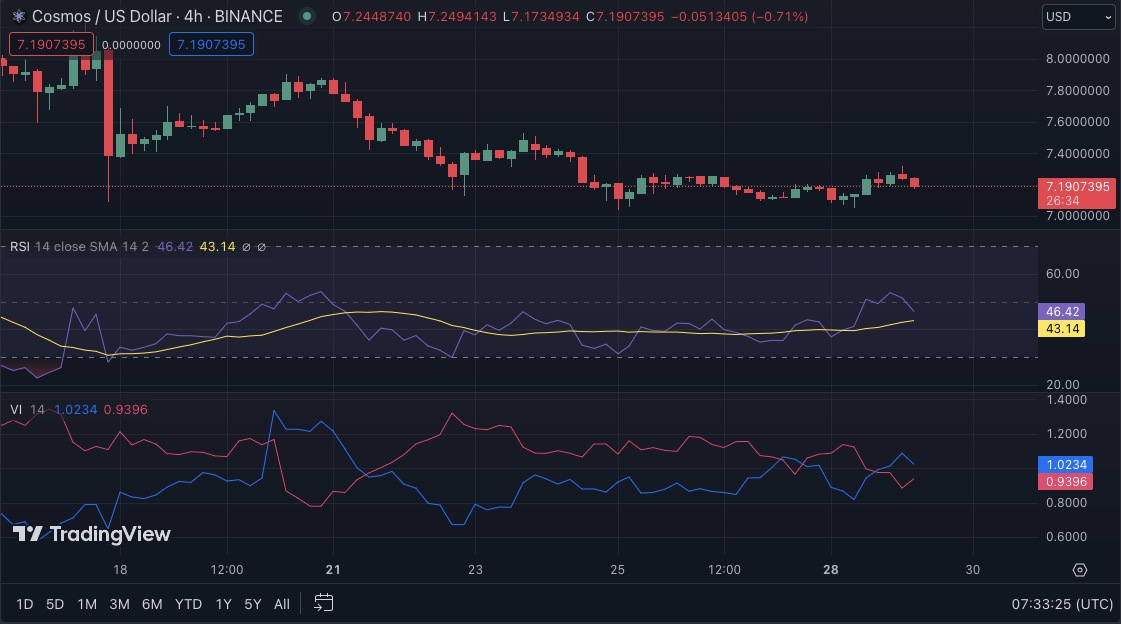
The Vortex Indicator (VI) analyzes the relationship between an asset’s closing price and its trading range to determine the direction and intensity of a trend. Consequently, the uptrend line (VI+) blue on the ATOM’s 4-hour price chart is heading downwards with a value of 1.0234, while the downtrend line (VI-) red is rising higher with a rating of 0.9396.
This trajectory suggests that the present ATOM trend may shift, with the uptrend losing strength and the decline gaining acceleration.
With the Relative Strength Index (RSI) at 46.71 and trending lower, the market’s purchasing pressure is fading. This trend lends credence to the potential change in ATOM’s present trajectory. If the RSI falls below its signal line and 40, it will confirm a bearish signal and enhance the basis for an ATOM downturn.
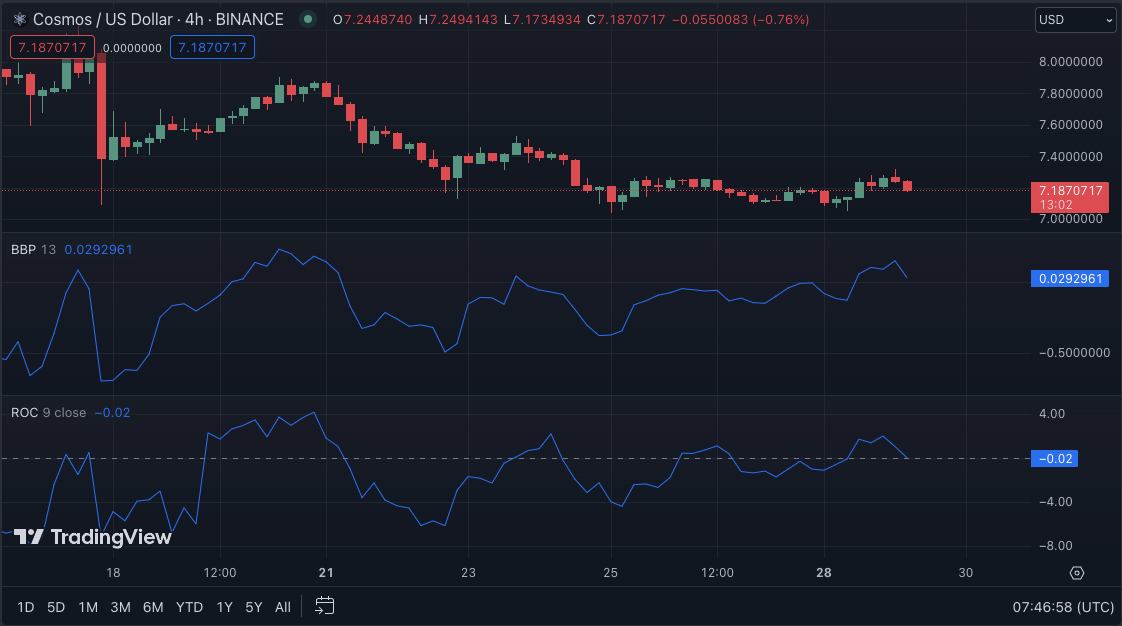
With a score of 0.0269032, the Bull Bear Power (BBP) is trending south, suggesting that the bears are gaining dominance and applying greater selling pressure on the market. This pattern is consistent with a growing downturn in ATOM and increases the probability of the bulls losing market control.
Furthermore, the Rate of Change (ROC) has dipped below zero at -0.01, indicating that the rate of ATOM’s price slip is rising. This negative ROC value reinforces the bearish warning and adds to the evidence of a possible ATOM downturn. As a result, traders should exercise care and use risk management methods to safeguard their ATOM investments.
In conclusion, while the ATOM’s initial recovery sparked optimism, the negative indicators caution a potential downward trend as buying pressure falters.
Disclaimer: The views, opinions, and information shared in this price prediction are published in good faith. Readers must do their research and due diligence. Any action taken by the reader is strictly at their own risk. Coin Edition and its affiliates will not be liable for direct or indirect damage or loss.
Disclaimer: The information presented in this article is for informational and educational purposes only. The article does not constitute financial advice or advice of any kind. Coin Edition is not responsible for any losses incurred as a result of the utilization of content, products, or services mentioned. Readers are advised to exercise caution before taking any action related to the company.


