


- Web3 data analyst revealed intricate details of an individual who acquired $2.6M.
- PEPE ranked first in the trending list according to CoinMarketCap.
- PEPE exhibits the next leg of forming the falling wedge.
Lookonchain, a Web3 data analysis tool, highlighted shared intricate details of how an individual acquired huge profits by trading PEPE tokens. In particular, the person made 1408 ETH, equivalent to $2.6 million, by spending 400K $USDC to buy 263B $PEPE at $0.000001519.
Moreover, this very person spent 46 $ETH to buy 1.66T $PEPE via three addresses from April 17 to 19. Thereafter, he sold all of them for 1,454 $ETH. Hence, the difference between what he spent and what he earned added up to 1408 ETH.
Meanwhile, the PEPE token is ranked first in the trending list according to CoinMarketCap, as of press time. However, the reason for it being ranked first in the trending list is yet to be found. When considering the seven-day chart for PEPE, it does not have much to price action that is praiseworthy.
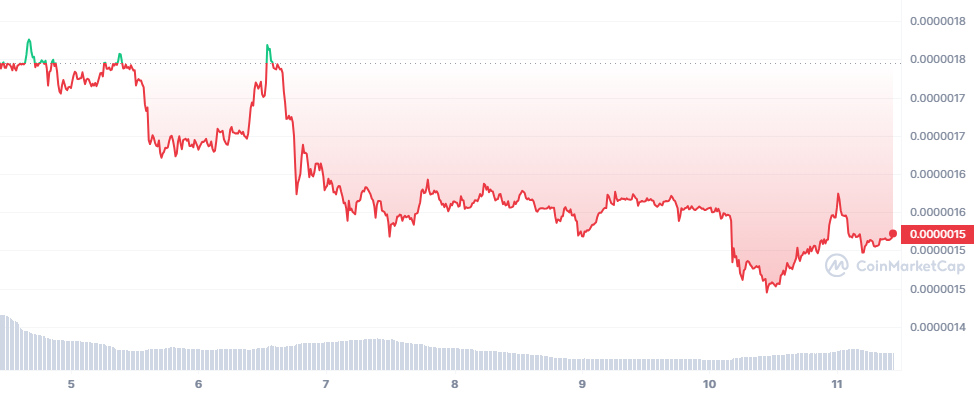
Since last Wednesday, June 5, the token has been in the red zone, emerging into the green zone for just a brief period before submerging into the red zone again. Although during the first three days of the week, PEPE had a considerable fall, the next four days were followed by consolidation. As of press time, PEPE is exchanging hands at $0.000002, with an increase of 5.63% in the last 24 hours.
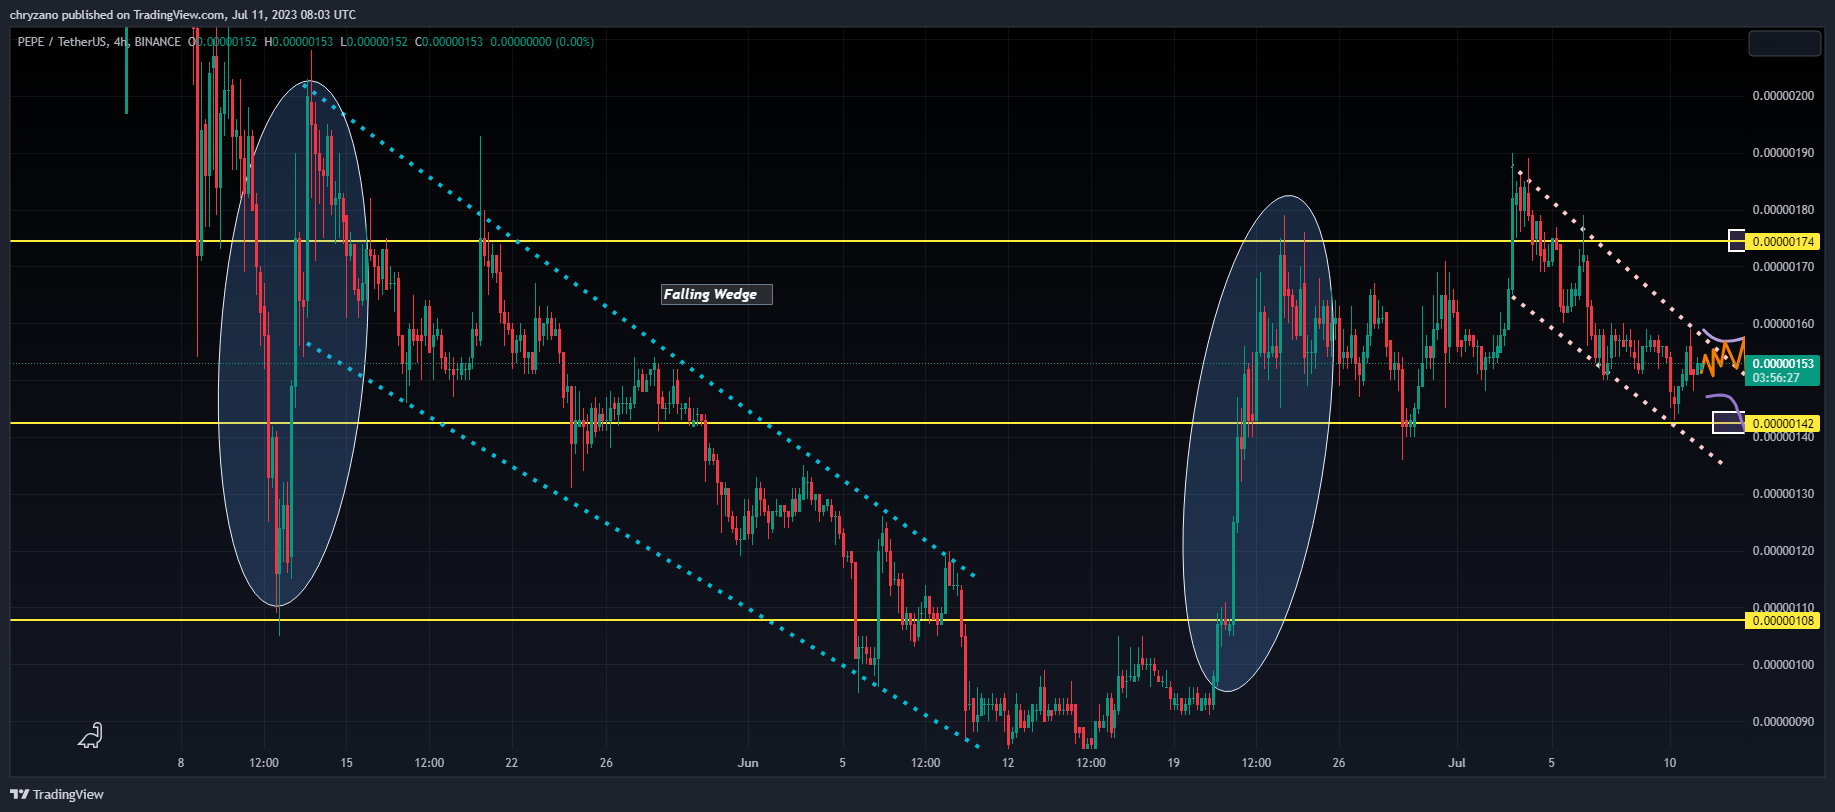
The above chart demonstrates PEPE fluctuating inside two falling wedges, one in mid-May and the present one. The present falling wedge could be the start of the next falling leg for PEPE. To supplement the fact that this could be the next leg of the falling wedge for PEPE, there are a few hints that should be considered.
For instance, when comparing the falling wedge back in May with the present falling wedge, as shown above, it could be seen that PEPE had a large spike in price just before forming the falling wedge. Additionally, the price fluctuation within the wedge is also not too different. Hence, this could be considered the next leg of PEPE losing value.
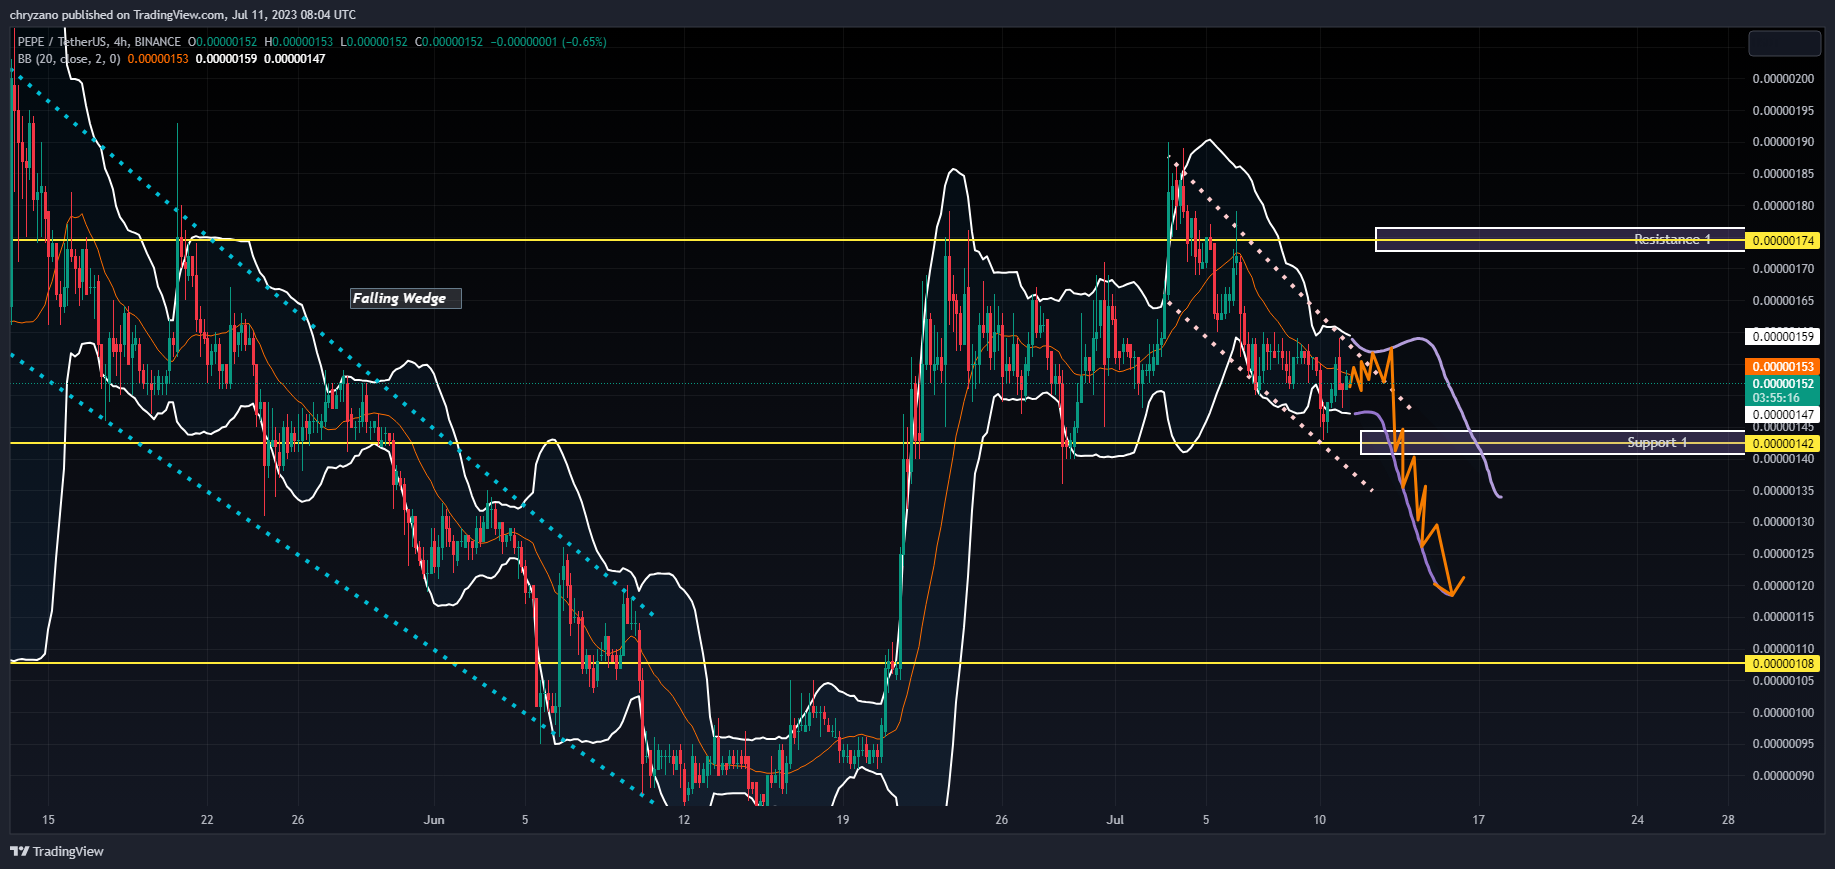
Moreover, the Bollinger bands, which are titling downwards, are maintaining a constant between them. This instills that PEPE could be losing value in the future. Since PEPE is close to the Simple Moving Average of the Bollinger Band, it may rise toward the upper band before retracing. Once it reaches the upper band, it might crash along the lower band.
As such, if PEPE falls, it may seek support at $0.00000142, and if its fall is not stopped at the aforementioned support, it could crash further to $0.00000108. However, if the bulls charge and uplift PEPE, then it may reach $0.00000174.
Disclaimer: The views and opinions, as well as all the information shared in this price analysis, are published in good faith. Readers must do their own research and due diligence. Any action taken by the reader is strictly at their own risk. Coin Edition and its affiliates will not be held liable for any direct or indirect damage or loss.
Disclaimer: The information presented in this article is for informational and educational purposes only. The article does not constitute financial advice or advice of any kind. Coin Edition is not responsible for any losses incurred as a result of the utilization of content, products, or services mentioned. Readers are advised to exercise caution before taking any action related to the company.


