 Price Analysis: Can the Coin Retest $0.09?")
- Sellers continue to dictate the momentum, suggesting a decline to $0.071.
- The OBV on the 4-hour chart stalled, indicating a lack of buying pressure.
- If bulls defend the support at $0.076, then DOGE might jump above $0.083.
Dogecoin (DOGE) looked bearish on the 4-hour chart analyzed from TradingView. From the chart, DOGE has struggled to breakout of the $0.080 region. This inability to climb past the region pushed down its price as it fell to $0.795.
If a breakout happens, DOGE might climb to $0.083 in the short term. But from a bearish perspective, the price of DOGE might close below $0.076. Dogecoin’s price in the last 30 days has decreased by 3.81%, CoinMarketCap showed.
DOGE/USD 4-Hour Chart
The decrease reflects how sellers have been controlling the narrative for most of the new year. Furthermore, indications from the Awesome Oscillator (AO) showed that the reading was negative.
The reading signaled increasing downward momentum which could pull down DOGE’s price. If the next histogram bar on the AO drops lower than the last, then bears might dictate the coin’s momentum.
Should this happen, DOGE’s price might drop to the range of $0.071 to $0.076 within the next week. But a return of buyers which seemed unlikely could trigger a price increase for the coin. In this instance, DOGE might cross past $0.083 and target $0.090.
However, signals from the On Balance Volume (OBV) did not predict a bullish outcome. At press time, the OBV stalled, indicating that volume up and volume down over the last few days have been similar.
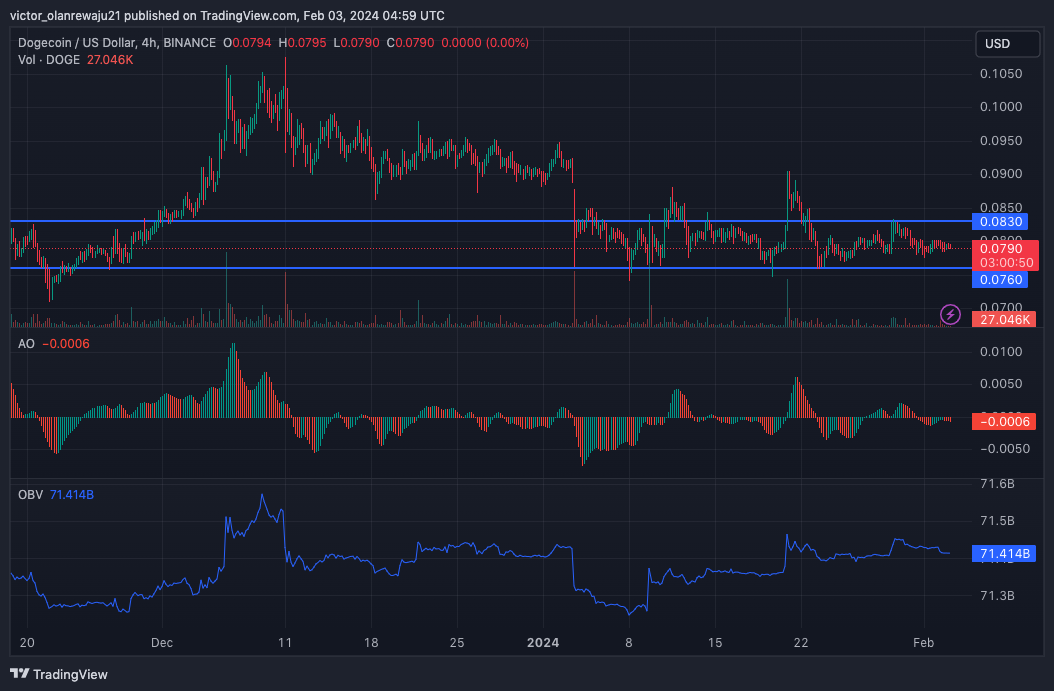
Therefore, DOGE’s price might continue to consolidate for the time being since buying pressure was almost non-existent and selling pressure had begun to fizzle out.
DOGE/USD Daily Chart
On the daily timeframe, DOGE exhibited a bearish structure, confirming that bears were still the dominant sect. But like the 4-hour chart, there were attempts to $0.090. However, the move might be neutralized as DOGE was struggling to hold on to the support at $0.076.
If the price breaks below, the support DOGE might drop to $0.070. Coin Edition also considered the Exponential Moving Average (EMA).
At press time, the 9 EMA (blue) was at $0.0796 while the 20 EMA (yellow) was at $0.0805. The crossover of the 20 EMA over the 9 EMA suggests a bearish trend. In addition, DOGE’s price being below those zones suggests a possible price decline.
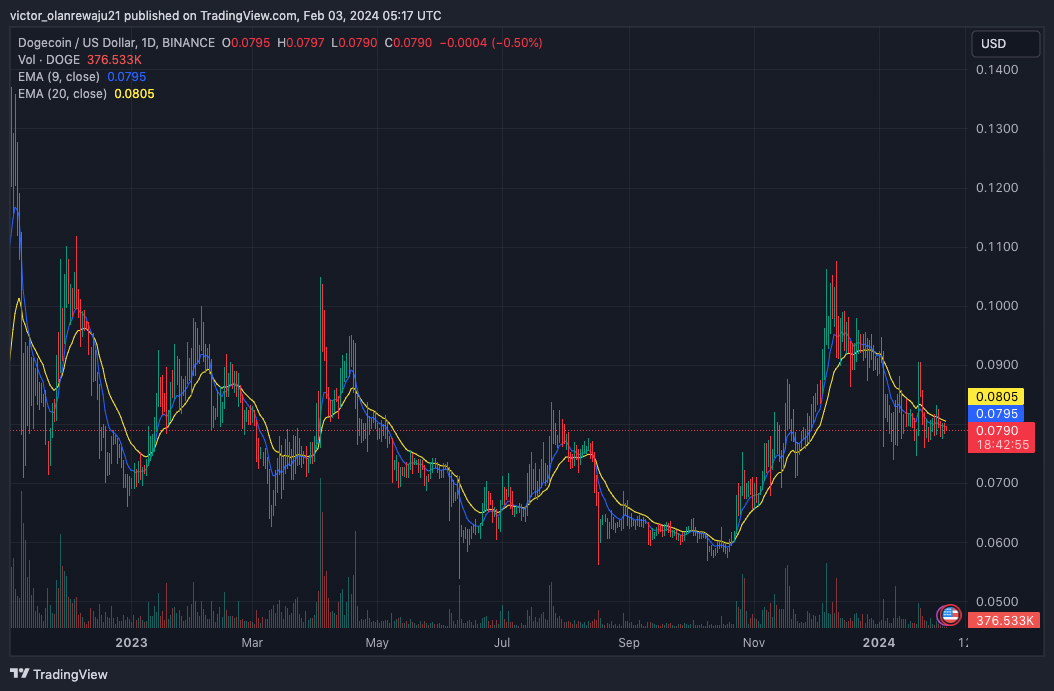
In a highly bullish case, DOGE might move past $0.080. But if the aforementioned trend persists, then the coin might drop to $0.070. If bulls do not appear to defend DOGE, the price might close below $0.070.
Disclaimer: The information presented in this article is for informational and educational purposes only. The article does not constitute financial advice or advice of any kind. Coin Edition is not responsible for any losses incurred as a result of the utilization of content, products, or services mentioned. Readers are advised to exercise caution before taking any action related to the company.
")


