


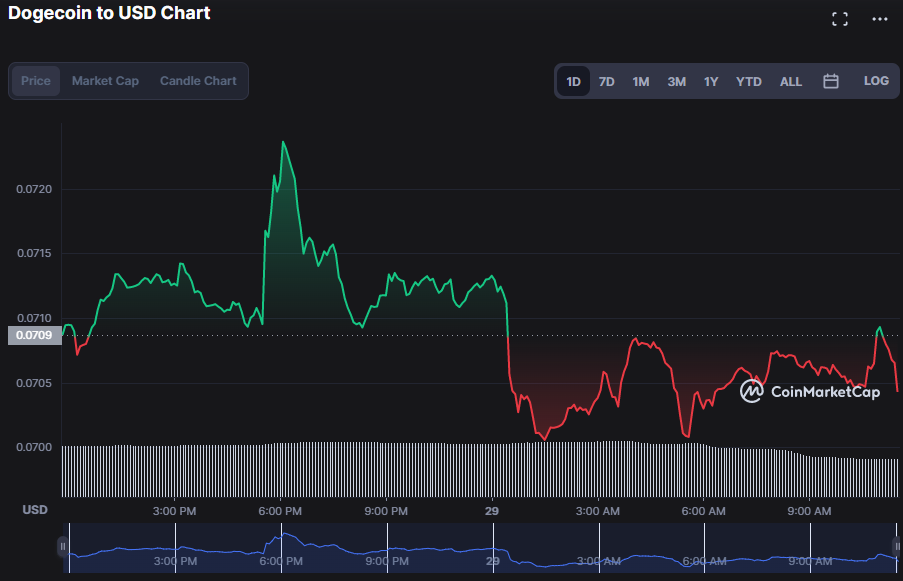
- The DOGE price chart illustrates a dismal downward market trend.
- The bears gained control of the market as the price of DOGE dropped 0.23 % to $0.07061.
- A continuation of the negative trend is reflected by the indicators leaning southwards.
The Dogecoin (DOGE) market has had a bullish influence in the previous 24 hours; however, this upward trend was short-lived after hitting resistance around $0.07238. Bears took control of the market following this resistance and successfully pulled DOGE down to $0.07042, a 0.64% drop.
This notion is supported by the fact that the market capitalization and 24-hour trading volume both declined by 0.71% and 26.13%, respectively, to $9,338,177,766 and $336,010,129, ranking #8.
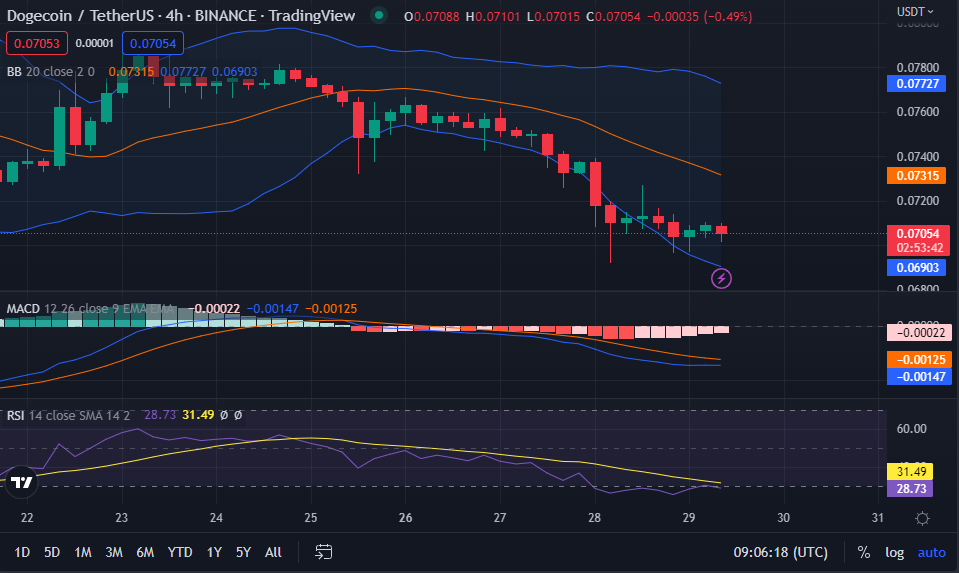
Bollinger Bands are moving southward and bulging on the DOGE price charts, indicating a deteriorating market. At 0.07728 and 0.06900, the top and lower bands make contact. Bear strength is expected to be developing as the price continues to move below the signal line and towards the lower band, suggesting that additional negative effects are to be anticipated.
Moving Average Convergence Divergence (MACD) is sloping southward and dropping below the signal line on the 4-hour price chart. The signal line reading is -0.00125, while the MACD reading is -0.00148. Another factor supporting this bearish trend is the histogram’s positioning in the negative zone. This motion lends credence to the view that the DOGE market’s bear trend will continue for the foreseeable future.
The Relative Strength Index just crossed below its signal line, indicating that selling pressure is outweighing buying pressure. With a value of 28.40, the blue MACD line is heading towards oversold territory, indicating that the bear reign is not yet done.
A bearish crossover develops when the short-term moving average falls below the long-term moving average. The 20-day moving average is 0.07316, while the 50-day moving average is 0.07487, supporting this notion. Furthermore, the market’s current price is below both the MAs, signaling that the DOGE price is expected to decline further. If the negative trend persists, the $0.07005 support level may be breached.
Currently, the Chaikin Money Flow (CMF) is at 0.01; this positive trend suggests that bears are losing ground and bulls may have a chance.
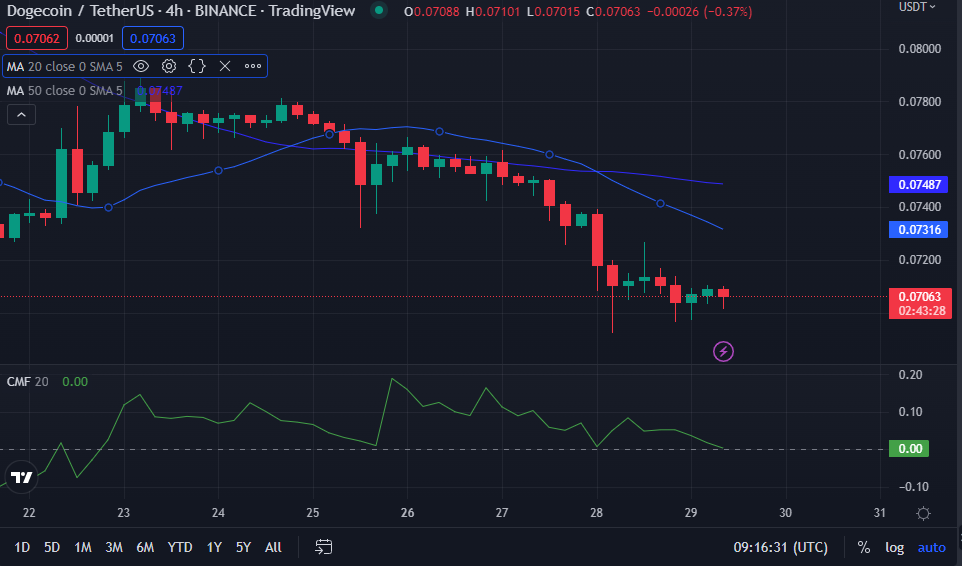
To challenge the bears’ hegemony and halt the negative trend in the present market, the bulls must push prices higher and defend the resistance level.
Disclaimer: The views and opinions, as well as all the information shared in this price analysis, are published in good faith. Readers must do their own research and due diligence. Any action taken by the reader is strictly at their own risk, Coin Edition and its affiliates will not be held liable for any direct or indirect damage or loss.
Disclaimer: The information presented in this article is for informational and educational purposes only. The article does not constitute financial advice or advice of any kind. Coin Edition is not responsible for any losses incurred as a result of the utilization of content, products, or services mentioned. Readers are advised to exercise caution before taking any action related to the company.


