


- In a recent price review, the price of DOGE increased by 0.18%.
- The RSI in the 1-hour chart of DOGE sits at 39.58.
- On the 1-hour chart, DOGE finds support at $0.07965 and resistance at $0.08787.
The hourly chart of DOGE shows that the digital currency’s price has dramatically gone down by a lot in the last few hours. However, looking at the 24-hour time frame, DOGE has only fluctuated by an increase of 0.18%.
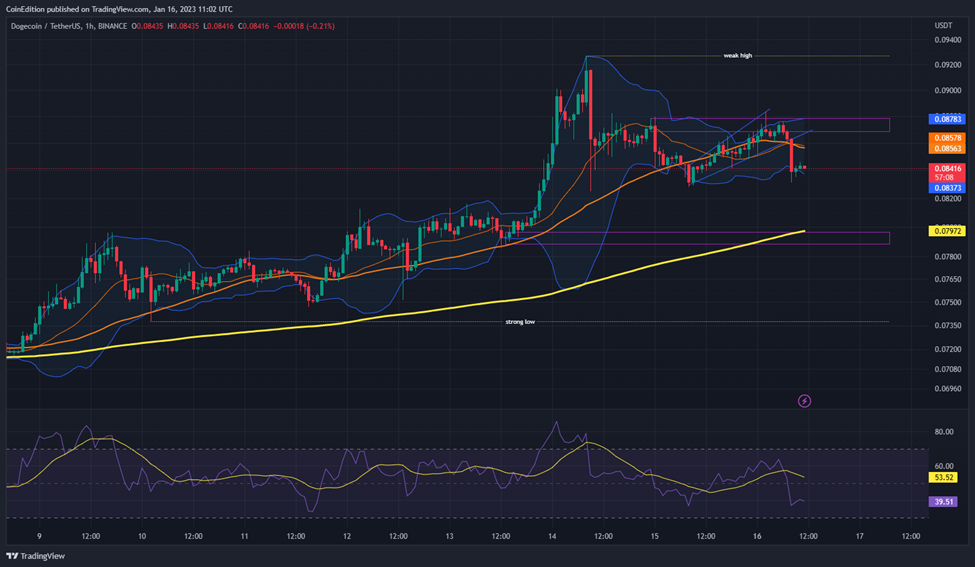
Above is the 1-hour technical analysis of DOGE/USDT. Moreover, DOGE was trading inside the rising wedge and after fulfilling the sell order block at $0.08683 and $0.08787, DOGE drove back to $0.08392 within an hour.
By looking at the Bollinger band, the bands are neither contracting nor expanding while the upper band is at $0.08783 and the lower band is placed at $0.08371. Bollinger bands also work as the support and resistance therefore, traders can check these bands’ levels before taking their trade for a good risk-to-reward ratio.
Moreover, the Relative Strength Index (RSI) shows a line at 39.58 and a rising gradient edging away from the 30-oversold boundary and steadily climbing to the 50-center line. If the RSI score remains stable, this can be a bullish indicator because it indicates that buying and selling activity is balanced.
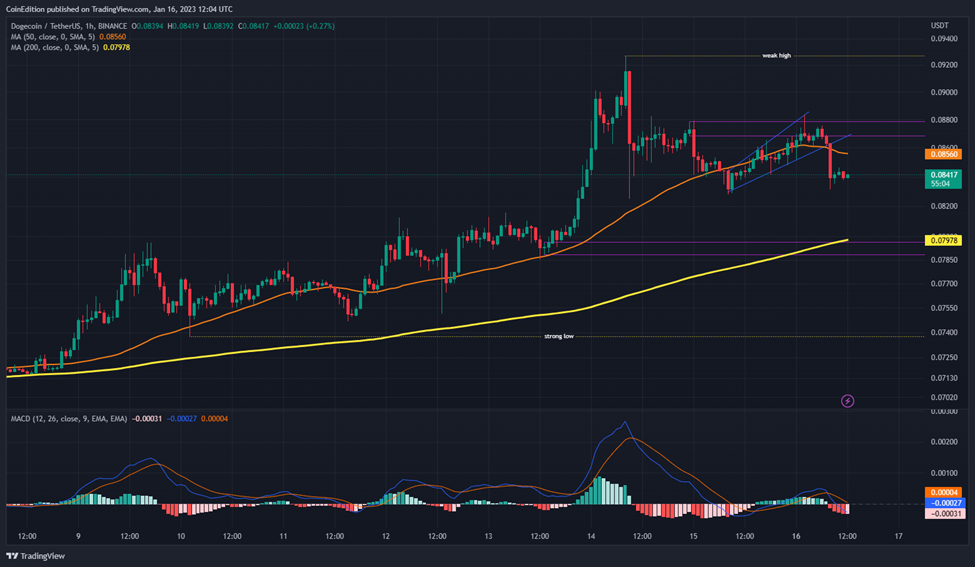
The above chart shows that the MACD line has crossed below the signal line, indicating that the MACD line has lost momentum after previously being above the signal line. However, the MACD line is still in negative territory, and the blue MACD line contacts -0.00027 while the signal line contacts 0.00004.
The majority of the technical indicators on the daily price chart point upward, raising the possibility that the rising momentum displayed by BTC is to be followed. DOGE is also above 200-day Moving Average, meaning that DOGE is in a bullish trend now.
Disclaimer: The views and opinions, as well as all the information shared in this price analysis, are published in good faith. Readers must do their own research and due diligence. Any action taken by the reader is strictly at their own risk, Coin Edition and its affiliates will not be held liable for any direct or indirect damage or loss.
Disclaimer: The information presented in this article is for informational and educational purposes only. The article does not constitute financial advice or advice of any kind. Coin Edition is not responsible for any losses incurred as a result of the utilization of content, products, or services mentioned. Readers are advised to exercise caution before taking any action related to the company.


