


- The Polkadot market sees a reversal of its recent downswing as bulls seize control.
- As the market finds stability around $5.04, bears give up.
- If buyers keep pressing, the resistance level will be breached.
Bulls have been in charge of trading on the Polkadot (DOT) market all day. After the buyers hit a wall at $5.26, the sellers stepped in and drove the price down to a session low of $5.04. However, bulls have pushed the price up to $5.22, a 1.80% increase, as of publication, canceling out the bear trend.
This surge was supported by increases in market capitalization and 24-hour trading volume of 1.85% to $6,028,023,147 and 11.63% to $193,671,476, respectively. This increase indicates that interest in the DOT market is growing, implying that a further bull run is on the way.
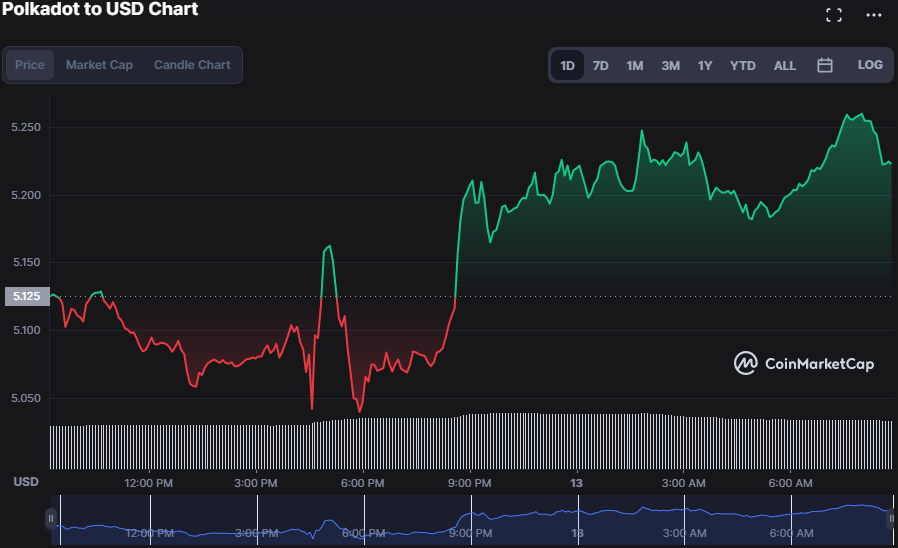
After bulls pushed the DOT price to an intraday high of $5.26 and encountered resistance, bears jumped in and drove the price down to $5.04. If the bulls’ rule continues, the next potential barrier levels might be around the prior resistance of $5.26, which if broken could accelerate the price to new highs, or the support of $4.90, which if breached could lead to a protracted downward trend for DOT. If bears regain control, however, the price might fall significantly, possibly as low as $4.58, the previous support level before DOT soared up to $5.26.
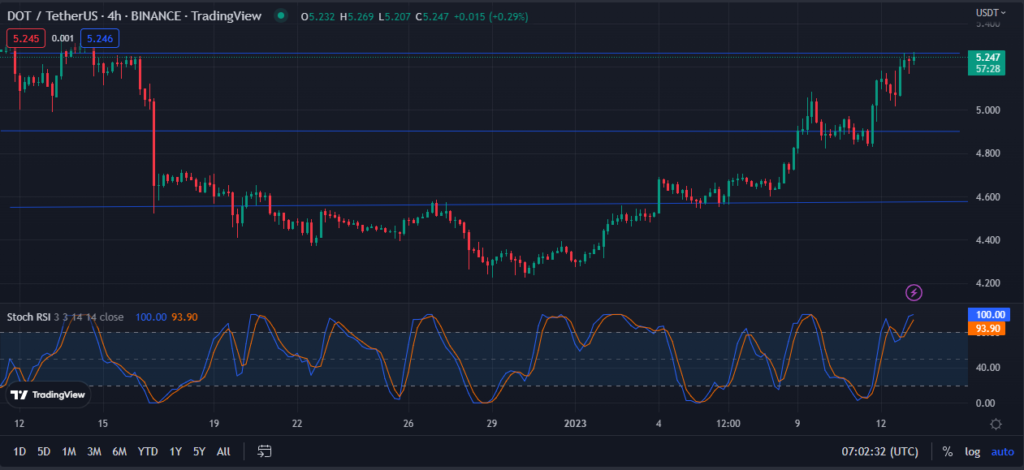
The DOT market has a stochastic RSI rating of 100.00, indicating that it is overbought, encouraging traders to pay attention to the DOT/USD pair. Since a stochastic RSI score of 100.00 indicates overbought market conditions, traders should be cautious when trading DOT. This activity indicates bears may be entering the market and a downward price movement may be forthcoming.
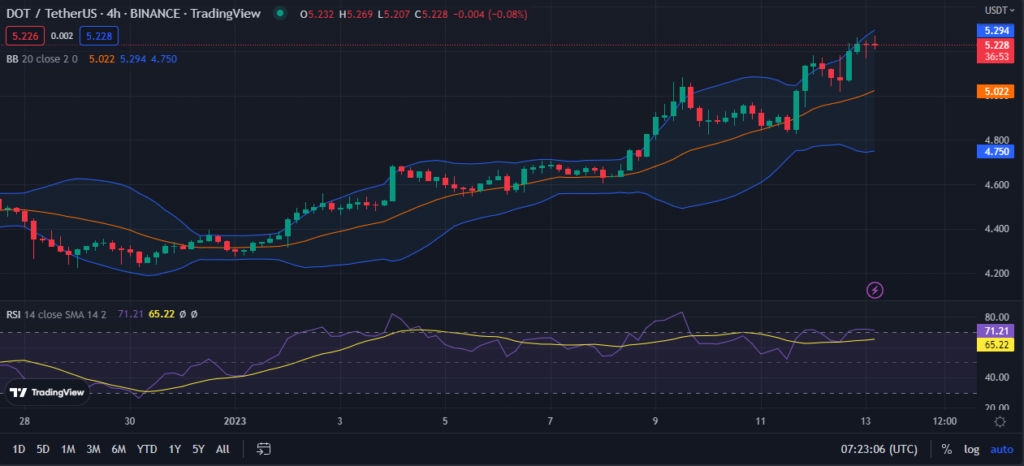
The Bollinger Bands are rising and bulging on the DOT market, with the upper band touching at 5.298 and the lower band touching at 4.748, implying that bullish domination will continue. This movement of the Bollinger bands indicates that prices may be rising due to increased purchasing demand, and that the market’s momentum is likely to continue in this direction.
A break above the upper band would be an encouraging indicator that the stock price is set to rise. A breach below the lower zone, on the other hand, may indicate a gloomy mindset and a further drop in the price of DOT.
With an RSI reading of 71.71 on the DOT market, further investing is discouraged at this time due to the strong likelihood of a market downturn. This is because the RSI level indicates that the market is approaching overbought territory, implying that prices are more likely to fall than rise in the near future.
If bulls keep up the pressure, the technical indicators predict DOT market will continue to favor the bulls.
Disclaimer: The views and opinions, as well as all the information shared in this price analysis, are published in good faith. Readers must do their own research and due diligence. Any action taken by the reader is strictly at their own risk. Coin Edition and its affiliates will not be held liable for any direct or indirect damage or loss.
Disclaimer: The information presented in this article is for informational and educational purposes only. The article does not constitute financial advice or advice of any kind. Coin Edition is not responsible for any losses incurred as a result of the utilization of content, products, or services mentioned. Readers are advised to exercise caution before taking any action related to the company.


