


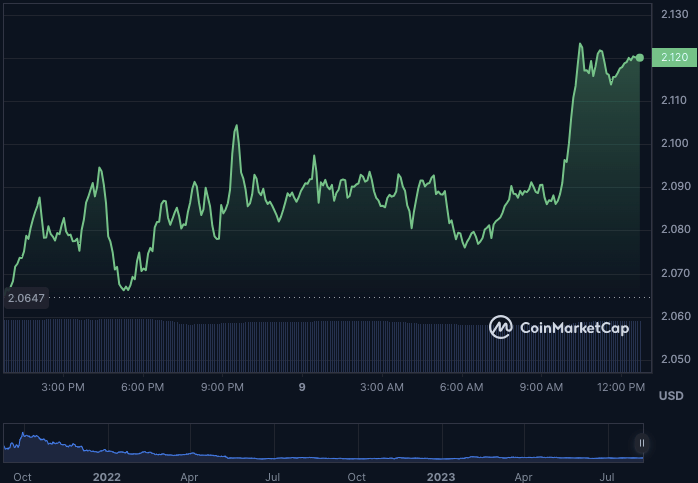
- DYDX’s bullish momentum eyes $2.15 resistance after surging from $2.06 to $2.12 in 24 hours.
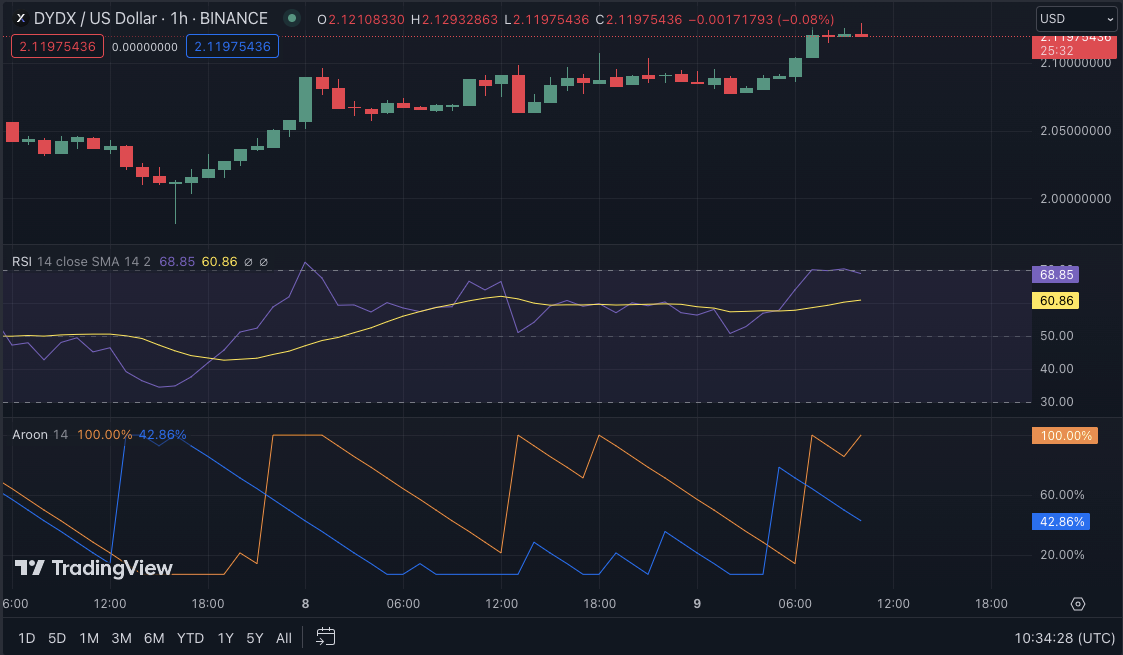
- RSI’s robust 72.14 reading suggests a potential price rise, but caution grows due to overbought conditions.
- Aroon confirms an uptrend with 100% Up, but 42.86% Down signals caution.
The dYdX (DYDX) market has experienced bullish solid momentum over the past 24 hours, with bulls rising from a support level of $2.06 to a high of $2.12 as of press time. The next resistance level is around $2.15 if bullish momentum surpasses the 24-hour high.
The previous support level of $2.06 may serve as a potential target for a pullback, though, if the bullish momentum weakens.
During the upturn, the market capitalization of DYDX increased by 2.87% to $331,881,258, while its 24-hour trading volume decreased by 0.71% to $41,654,293. Profit-taking by some investors may be to blame for this drop in trading volume. On the other hand, the overall rise in market capitalization indicates that there is still a lot of interest in DYDX and the potential for further price growth.
The Relative Strength Index (RSI) on the DYDXUSD price chart is rising with a reading of 72.14, indicating that the bullish momentum is strong.
This trend indicates intense buying pressure in the market and that the price will likely rise further soon. However, traders should exercise caution because an RSI reading above 70 may indicate an overbought condition, which could result in a price reversal or correction.
The Aroon up reads 100% and points upwards, while the Aroon down reads 42.86% and points downwards, implying that the uptrend is strong and likely to continue. The Aroon indicator confirms the presence of market buying pressure, indicating a higher likelihood of further price increases.
Traders should, however, proceed with caution and keep an eye out for any signs of a potential reversal or correction, as indicated by the Aroon down reading and its downward-pointing direction.
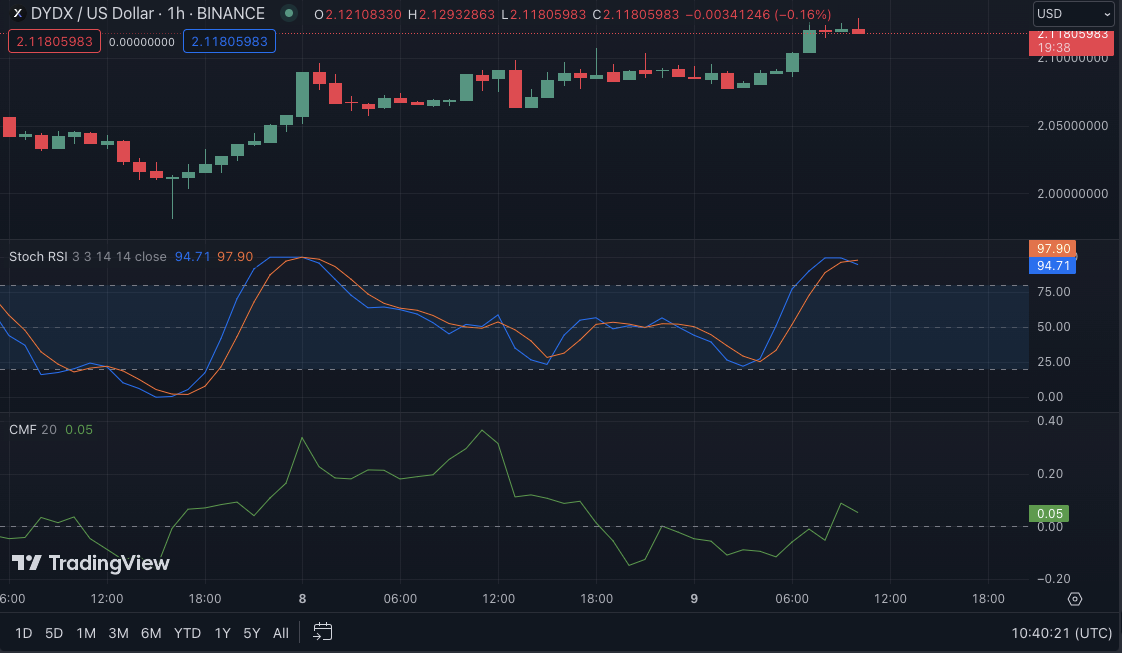
With a stochastic RSI of 94.71, the market appears overbought and may be due for a pullback or consolidation. To protect against potential downside risks, traders should consider taking profits or tightening stop-loss levels.
The Chaikin Money Flow trending south with a reading of 0.05 indicates that the market is under selling pressure. This level suggests that there may be a decrease in buying interest and a potential price decrease.
Before considering new long positions, traders should exercise caution and wait for a reversal or increase in the Chaikin Money Flow.
In conclusion, DYDX’s bullish surge shows potential for further gains, but caution is advised due to overbought signals and selling pressure.
Disclaimer: The views, opinions, and information shared in this price prediction are published in good faith. Readers must do their research and due diligence. Any action taken by the reader is strictly at their own risk. Coin Edition and its affiliates will not be liable for direct or indirect damage or loss.
Disclaimer: The information presented in this article is for informational and educational purposes only. The article does not constitute financial advice or advice of any kind. Coin Edition is not responsible for any losses incurred as a result of the utilization of content, products, or services mentioned. Readers are advised to exercise caution before taking any action related to the company.
: What Happens If You Use an Unlicensed Platform?")


