


- Addresses holding 1,000+ ETH decreased, and a long-term whale sold.
- Although the directional index is weak, ETH’s -DMI puts control in the hands of bears.
- Downward momentum is increasing, and ETH could soon fall to $1,590.
On-chain analytic platform Glassnode shared that the number of addresses holding 1,000 Ethereum (ETH) coins hit a 5-year low. According to the disclosure, the decrease caused the number of addresses with such an amount in their portfolio to fall to 6,082.
A simple interpretation of the data means that some long-term holders of ETH have been selling. As a result, this puts ETH at risk of another decline. Apart from the cohort mentioned above, there has been another individual culpable for pushing down the price of ETH.
According to Lookonchain, a Web3 data analysis tool, a 4-year-old dormant wallet sold all the ETH available on it for $4.81 million. This means that the altcoin has had to face a lot of selling pressure within a few hours.
However, the impact on ETH has been considerably low as the price has remained at $1,600. But there’s a possibility that ETH’s price could drop below $1,600, as Coin Edition reported earlier. On the technical front, ETH’s momentum has been swinging between the claws of bulls and bears.
At press time, bears had more control since ETH faced rejection at $1,659. The result of the resistance was a decrease to $1,622, which once acted as a support zone for ETH. Furthermore, the Directional Movement Index (DMI) indicates that the presence of bulls may be fully extinct soon.
This was because the +DMI (green) was 21.91, and the -DMI (red) was 21.93. Although both indicators had close values, the direction of the -DMI was largely upward while the +DMI faced the downside. These opposite directions served as a rationale for the conclusion.
Another indicator to consider is the Average Directional Index (ADX). When the ADX is 25 or above, it indicates a strong direction. Conversely, an ADX below 25 suggests a weak direction for the asset involved.
At the time of writing, the ADX was 14.64, meaning bears may still have to deal with some buying presence if the target is for ETH to fall below $1,600. Meanwhile, the desire of bears may have already been set in motion, as indicated by the Moving Average Convergence Divergence (MACD).
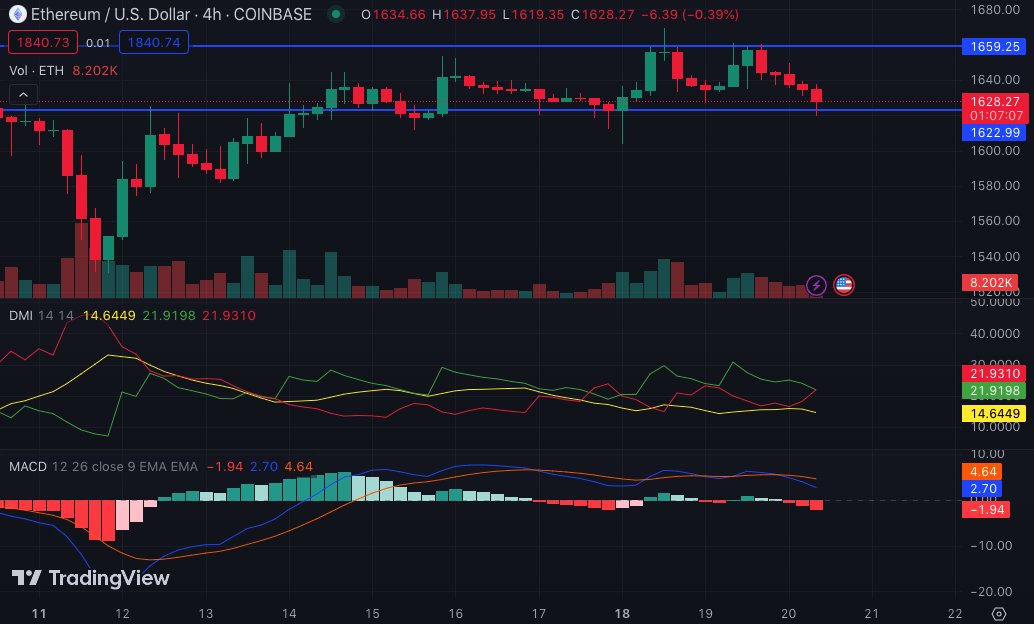
From the chart above, the MACD was -1.95. This means that the shorter EMA has diverged below the longer EMA. So, the downward momentum is increasing, and ETH may finally hover around $1,590 or thereabouts.
Disclaimer: The views, opinions, and information shared in this price prediction are published in good faith. Readers must do their research and due diligence. Any action taken by the reader is strictly at their own risk. Coin Edition and its affiliates will not be liable for direct or indirect damage or loss.
Disclaimer: The information presented in this article is for informational and educational purposes only. The article does not constitute financial advice or advice of any kind. Coin Edition is not responsible for any losses incurred as a result of the utilization of content, products, or services mentioned. Readers are advised to exercise caution before taking any action related to the company.
 Price Prediction 2026, 2027, 2028, 2029, 2030 -2050")


