


 Old Wallet Activity Spikes After Hitting $1,540")
- ETH’s price decline coincided with a notable movement of long-held ETH from older wallets, according to data from Santiment.
- This suggests that long-term ETH investors may be starting to capitulate and exit their positions.
- Earlier today, Ethereum made an attempt to regain ground above $1,580, but bears quickly countered this move.
The market intelligence platform Santiment shared in a Twitter (X) post today that Ethereum (ETH) recently experienced a significant drop in value, hitting a low of $1,540, which is a level not seen since 12 March 2023. What is particularly interesting is that this price decline coincided with a notable movement of long-held ETH from older wallets.
This shift in the ownership of stagnant ETH suggests that long-term investors may be starting to capitulate and exit their positions possibly due to the ongoing price drop, according to the post. This phenomenon was further underscored by the decreasing mean age of Ethereum tokens in circulation during this period.
Santiment also shared that such capitulation signs often serve as an indicator of potential reversals in the market, signaling that a bottom may be approaching as weaker hands sell off their holdings. Over the past 24 hours of trading, ETH’s price dropped by more than 2%, according to CoinMarketCap. This left the leading altcoin trading at $1,580.02 at press time.
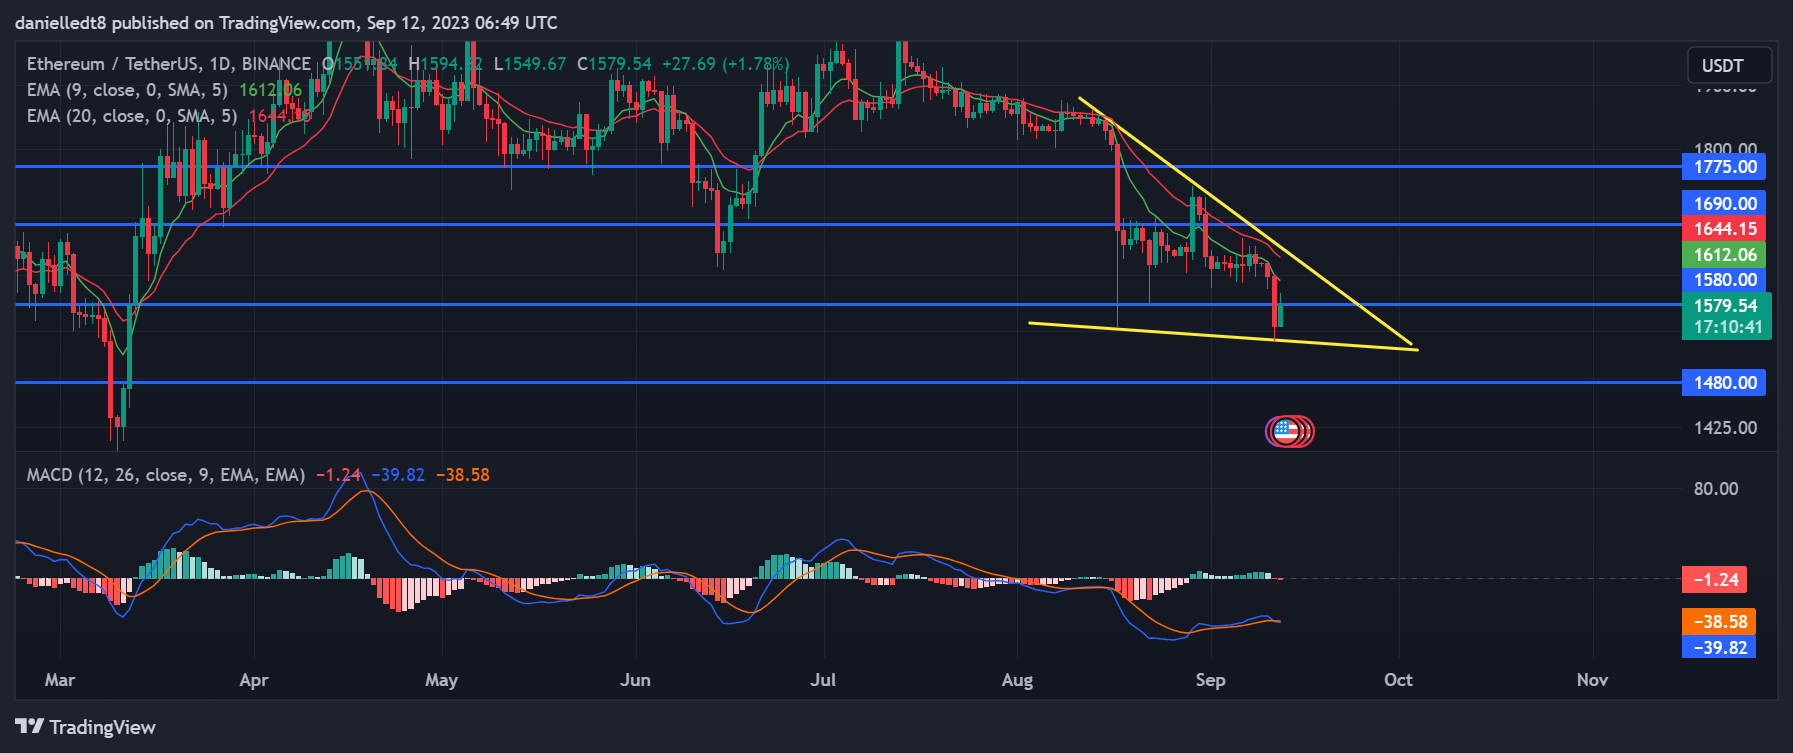
In the last 24 hours, the price of ETH dipped below the critical support level of $1,580 and concluded yesterday’s trading session below this mark. Earlier today, Ethereum made an attempt to regain ground above this significant level, but bears quickly countered this move, causing the cryptocurrency’s price to retreat.
Despite failing to reclaim the $1,580 level, ETH recorded a lower low yesterday. This, coupled with the lower highs that have been forming on ETH’s daily chart over the past two weeks, led to the emergence of a descending wedge pattern. This bullish chart pattern suggests the potential for Ethereum’s price to break out to the upside in the near future.
If this bullish pattern is confirmed, ETH’s price may surge past the $1,580 threshold, with the possibility of further gains in the next two weeks. If this upward momentum persists, Ethereum may attempt to turn the $1,690 resistance level into a support level. Subsequently, the cryptocurrency might aim to challenge the $1,775 barrier.
However, it is worth noting that it might take a few days for this pattern to be validated, as technical indicators on ETH’s daily chart currently indicate a bearish bias. Firstly, the 9-day Exponential Moving Average (EMA) is positioned below the 20-day EMA, suggesting bearish short-term momentum for ETH.
Additionally, a bearish technical flag was recently triggered as the daily Moving Average Convergence Divergence (MACD) line crossed below the daily MACD signal line. If these technical signals are confirmed, they could lead to further price declines for Ethereum. In such a scenario, the altcoin’s price could drop to as low as $1,480 in the coming days.
Disclaimer: The views and opinions, as well as all the information shared in this price analysis, are published in good faith. Readers must do their own research and due diligence. Any action taken by the reader is strictly at their own risk. Coin Edition and its affiliates will not be held liable for any direct or indirect damage or loss.
Disclaimer: The information presented in this article is for informational and educational purposes only. The article does not constitute financial advice or advice of any kind. Coin Edition is not responsible for any losses incurred as a result of the utilization of content, products, or services mentioned. Readers are advised to exercise caution before taking any action related to the company.


