


- ETH may break out of its tight trading range if the coin price hits $2,200.
- The 50 EMA had crossed over the 200 EMA, suggesting a bullish breakout in the mid to long-term.
- If ETH fails to flip the $2,042 resistance, the price may drop to $1,994.
Crypto analyst Altcoin Sherpa told his 198,900 X followers that the price of Ethereum (ETH) would reach $3,000 in the next few months. Sherpa, who sounded confident of his prediction, referred to ETH’s historical price action.
In backing up his point, the analyst noted that the ETH price has not closed above $2,200 in about a year and a half. He added that this altcoin’s inability to hit the said value would be the reason leading to the projected breakout.
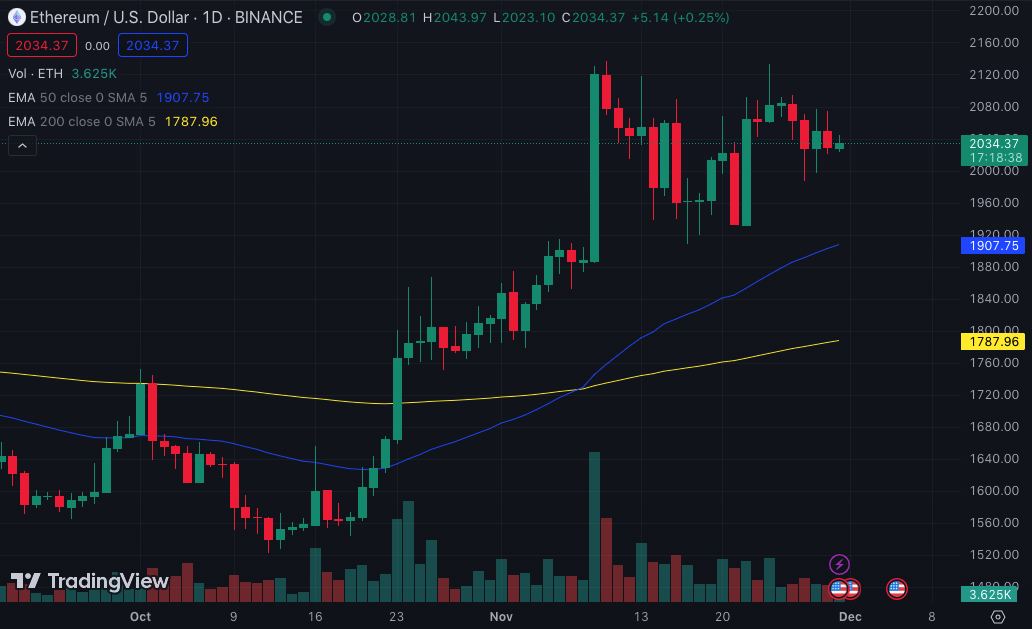
ETH Forms a Golden Cross
At press time, ETH’s value was $2,038. Earlier in the week, the coin broke above $2,100. However, negative market sentiment coupled with some selling pressure pushed the price back below $2,100.
At the same time, ETH’s ability to hold on to the $2,000 range could serve as a sign of mild strength, especially as the cryptocurrency languished between $1,800 and $1,900 for a long period. In the short term, it is likely for ETH to keep trading between $1,800 and $2,100.
But in the next few months, as Sherpa said, the ETH/USD daily chart showed that the altcoin has the potential to break out of this tight trading range. This assertion was taken from the Exponential Moving Average (EMA).
At press time, the 50 EMA (blue) had crossed over the 200 EMA (yellow). This upward crossover or golden cross possesses properties linking a bullish breakout for establishing a long-term uptrend.
A Short-Term Decline Is Nearby
So, if ETH finally hits $2,200 and is accompanied by strong buying pressure, there is a possibility that it might reach $3,000. However, the road to a potential $3,000 price may not be linear. Therefore, traders might need to watch out for pullback in between.
Meanwhile, ETH’s short-term outlook is not exactly tilting bullish. According to the 4-hour chart, bulls have been unable to take bears out of the way in establishing an uptick. Also, there was a strong resistance at $2,042, which was responsible for pushing ETH back.
Bulls will likely attempt to flip the resistance. At the same time, sellers may resist. Should ETH get rejected again, there is a chance that it might drop to $1,994.
Additionally, the Relative Strength Index (RSI) was 46.64, indicating weakness for the altcoin. As long as the RSI remains below the 50.00 midpoint, ETH may find it hard to retest $2,100.

The possibility was also corroborated by the Awesome Oscillator (AO), which had dropped into the negative region. The AO reading is a sign of increasing downward momentum, which is not good for ETH’s short-term bullish prospects.
Disclaimer: The information presented in this article is for informational and educational purposes only. The article does not constitute financial advice or advice of any kind. Coin Edition is not responsible for any losses incurred as a result of the utilization of content, products, or services mentioned. Readers are advised to exercise caution before taking any action related to the company.
 Price Prediction 2026, 2027, 2028, 2029, 2030-2050")


