


- Potential investors and the community are closely watching the well-known two rivals of the crypto market — ETH and SOL.
- Indicators show that ETH could experience a bullish trend soon as buyers gradually enter the market.
- SOL shows signs of an early start which could be caused due its falling wedge pattern.
The crypto community is highly anticipating the cryptocurrency’s state after the Fed Meeting. Among the many digital assets, potential investors and the community are closely watching the well-known rivals of the crypto market — ETH and SOL. Let’s take a closer look at these altcoins’ price sentiments over time.
Ethereum’s Price Analysis
Looking at ETH/USDT 3-hour chart, the candlesticks are currently trading at $1,855, just below the Bollinger Bands’ middle line. In the mid-week of June, ETH, along with other altcoins, experienced a surge in their prices. This gigantic spike created the opportunity for ETH to cross beyond the $2,000 barrier.
However, ETH’s residence in the $2,000 level was short as it was kicked out by the sudden raid led by the bears. The surprise attack weakened ETH’s price gradually and the altcoin struggled to stay afloat at the $1,848 support level.

However, two indicators show a sign that ETH may recover over the following days. Firstly, the Bollinger bands seem to be squeezing and this could be a sign that a breakout may happen soon. The Bollinger Band squeeze could be a crucial point for most traders as it could speculate whether the breakout would be upwards or downwards.
Meanwhile, the RSI continues to move up which is a sign that buyers are entering the market. As more buyers enter, there may be a chance for ETH to rise. The ADX, valued at 17.28, claims the trend’s strength is weak, which could have happened due to the immediate fall observed earlier.
Solana’s Price Analysis
Solana’s native token seems to have entered the bull run early, however, further higher highs need to form for confirmation. SOL’s 3-hour chart shows that the candlesticks seem to forming in a falling wedge pattern and a break out which could lead to an uptrend could happen soon. There may be a chance that the recently formed green candlesticks could be SOL’s attempt to enter the bull market.
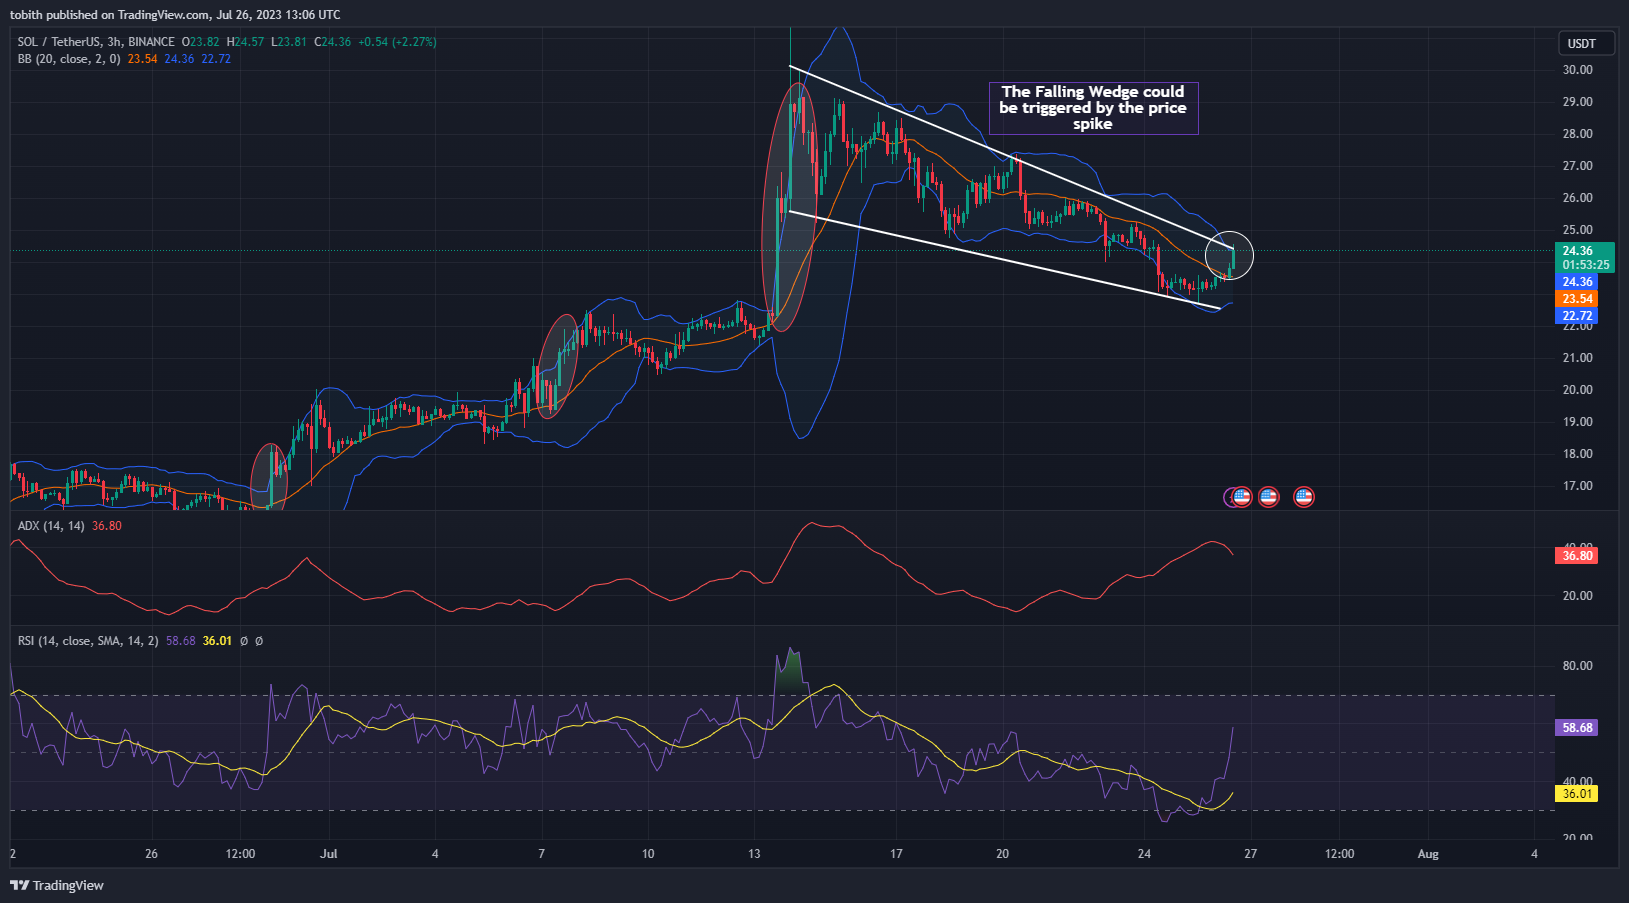
However, traders should note that the sudden increase in prices could also create an opportunity for sellers looking to make a profit, ultimately, leading to SOL’s fall. Currently, the RSI shows that a huge number of buyers have entered the market as it is valued at 60.75. Meanwhile, the ADX also confirms that the trend’s strength is strong as it is valued at 36.95. However, the ADX is also pointing downwards, which could be a sign that the trend’s strength may weaken over time.
Conclusion
SOL has a good start in this bull run race, however, there may be a chance of downfall due to its immediate price increase. Meanwhile, ETH has to still enter the bullish market and make a significant impact on its users.
Disclaimer: The views and opinions, as well as all the information shared in this price analysis, are published in good faith. Readers must do their own research and due diligence. Any action taken by the reader is strictly at their own risk, Coin Edition and its affiliates will not be held liable for any direct or indirect damage or loss.
Disclaimer: The information presented in this article is for informational and educational purposes only. The article does not constitute financial advice or advice of any kind. Coin Edition is not responsible for any losses incurred as a result of the utilization of content, products, or services mentioned. Readers are advised to exercise caution before taking any action related to the company.


