


 Breaks Out, Propelling 22.7% Rally for AAVE")
- ETH’s price spiked and hit $2,400, leading to a resurgence in AAVE’s value.
- The correlation coefficient between ETH and AAVE was a solid 0.92.
- A positive divergence shown by the RSI suggests that AAVE could hit $130.
The concern about Ether’s (ETH) struggles to breakout has finally been put to rest as the coin jumped above $2,400 on December 27. Though the coin’s price has decreased from its initial hike, the rise also spread to tokens linked to Ethereum.
One of the cryptocurrencies helped by ETH’s surge is Aave (AAVE). AAVE is the native token for open-source lending and borrowing in the DeFi ecosystem. According to CoinMarketCap, AAVE’s price had increased to $123.57 by press time.
Like ETH, Like AAVE
The increase represents a 22.70% climb in the last 24 hours. Many market players following Ethereum’s movement since the Merge might not be bewildered by AAVE’s correlation with ETH.
This is because of the way the Ethereum Merge had affected Aave’s Block time and liquidity as explained here. Also, Coin Edition recently reported a surge in the accumulation of AAVE, which could have had an impact on the token’s price.
Therefore, it was also important to consider Macroaxis data to assess the correlation between AAVE and ETH. At press time, AAVE had almost no divergence with ETH as the 90-day correlation coefficient was 0.92.
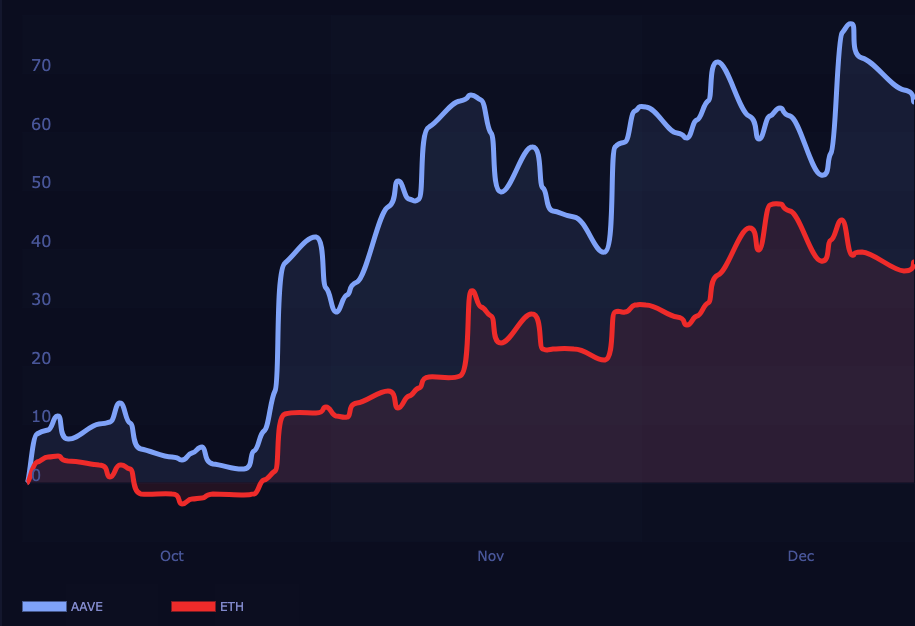
Values of the correlation coefficient are usually between -1 and +1. Assuming the coefficient was close to -1, then it would suggest a widespread divergence. However, like ETH and AAVE, a correlation coefficient close to 1 infers similar directional movement between two assets.
However, it is important to mention that AAVE’s performance either doubles or triples ETH’s performance anytime there is a rally. That was also the case this time as ETH increased by 7% compared to AAVE’s 22$ spike.
AAVE Likely to Keep Ascending
The price action of the last 24 hours has placed AAVE in an ascending direction, the 4-hour AAVE/USD chart showed. Solid demand for cryptocurrency has also helped bulls protect the support at $99.69.
However, it seemed like some traders had started to book profits with the red candlestick going down to $122.50. Regardless of the drawdown, bulls seem to have other plans that could stop the decline.
This projection was shown by the Relative Strength Index (RSI). At press time, the RSI was 70.69, indicating that AAVE was overbought. However, the reading may not foreshadow a correction because of the positive divergence formed on the indicator.
The pattern showed that bulls were trying to maintain the bullish momentum. Should this happen, sellers may not make a comeback and AAVE’s next target could be $130.
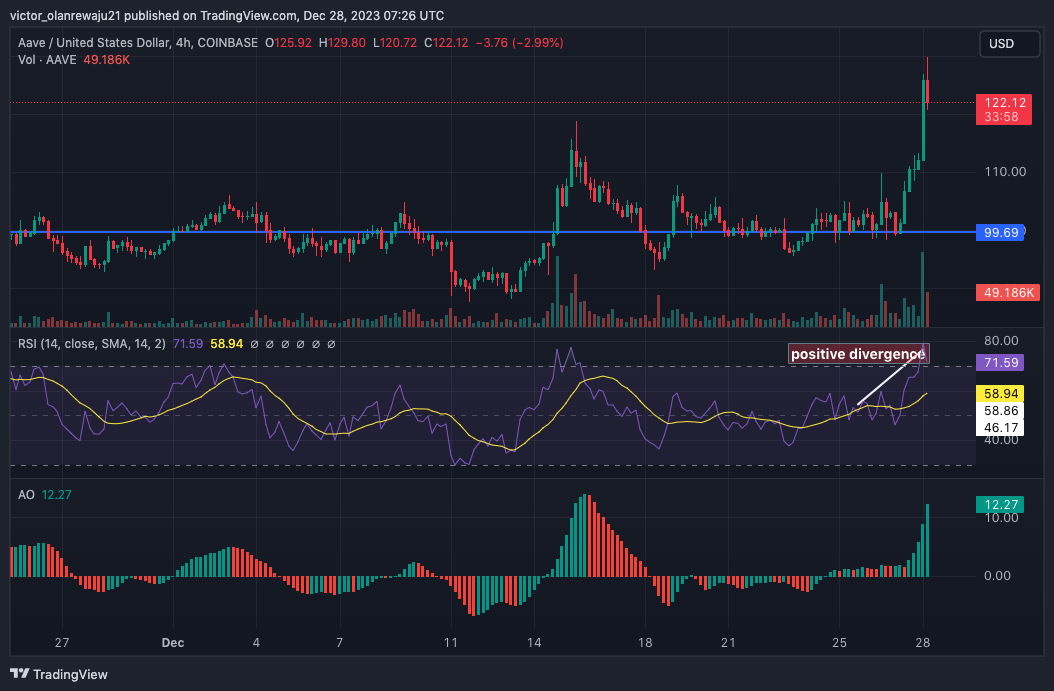
The possibility was also evident in the Awesome Oscillator (AO). As of this writing, the green histogram bars on the AO have been hitting new highs. This position signals increasing upward momentum.
So, as long as bears remain inactive, AAVE could be set to hit $130 or rise above the region in the coming days. Not to forget, the price action might also depend on ETH’s movement.
Disclaimer: The information presented in this article is for informational and educational purposes only. The article does not constitute financial advice or advice of any kind. Coin Edition is not responsible for any losses incurred as a result of the utilization of content, products, or services mentioned. Readers are advised to exercise caution before taking any action related to the company.


