



- Ethereum traded near $2,370 as perpetual futures open interest fell 15.95% in 24 hours.
- Funding eased from +0.0059% to +0.0045%, while the long-to-short ratio stood at 2.46.
- ETH held above $2,300 demand, with $2,352 support and $2,425.90 EMA resistance.
Ethereum traded near $2,371 on October 24 after perpetual-futures open interest fell 15.95% over 24 hours. Similarly, the ETH token faced a weaker risk backdrop following the Nasdaq’s 2.6% October 22 decline. This price analysis favors an orderly leverage reduction over a confirmed liquidity crisis.
Basically, falling prices alongside shrinking open interest can reflect traders closing positions, including longs. Yet those figures cannot distinguish voluntary exits from forced liquidations. Meanwhile, Ethereum remained above the wider $2,300 demand area during overnight trading.
| Chart Price | Open Interest (24H) | Funding Rate | Long/Short Ratio |
| $2,371.21 | −15.95% | +0.0045% | 2.46 |
Ethereum Open Interest Falls 15.95% as Data Favor an Orderly Reset
Ethereum’s funding rate stood at +0.0059% before settling at +0.0045% on October 24. Both readings stayed positive, meaning long-paid shorts as leveraged demand cooled. Despite the decline, Ethereum’s long-to-short account ratio stood at 2.46, favoring longs.
ETH therefore retained directional exposure even as outstanding contracts declined. For Ethereum, the price analysis treats that contraction as deleveraging, not evidence of a liquidation cascade.
However, without supporting liquidation data, the extent of forced selling remains unclear. For ETH, lower leverage may ease liquidation pressure without confirming stabilization.
Four-Hour ETH Breakdown Tests $2,352 as Buying Pressure Weakens
Meanwhile, the four-hour chart showed a failed rebound toward $2,500 around October 21 before selling pushed below $2,418. Ethereum subsequently traded near $2,371.21, beneath its 50-period exponential moving average at $2,425.90. On the other hand, ETH faced immediate chart support at $2,352.15.
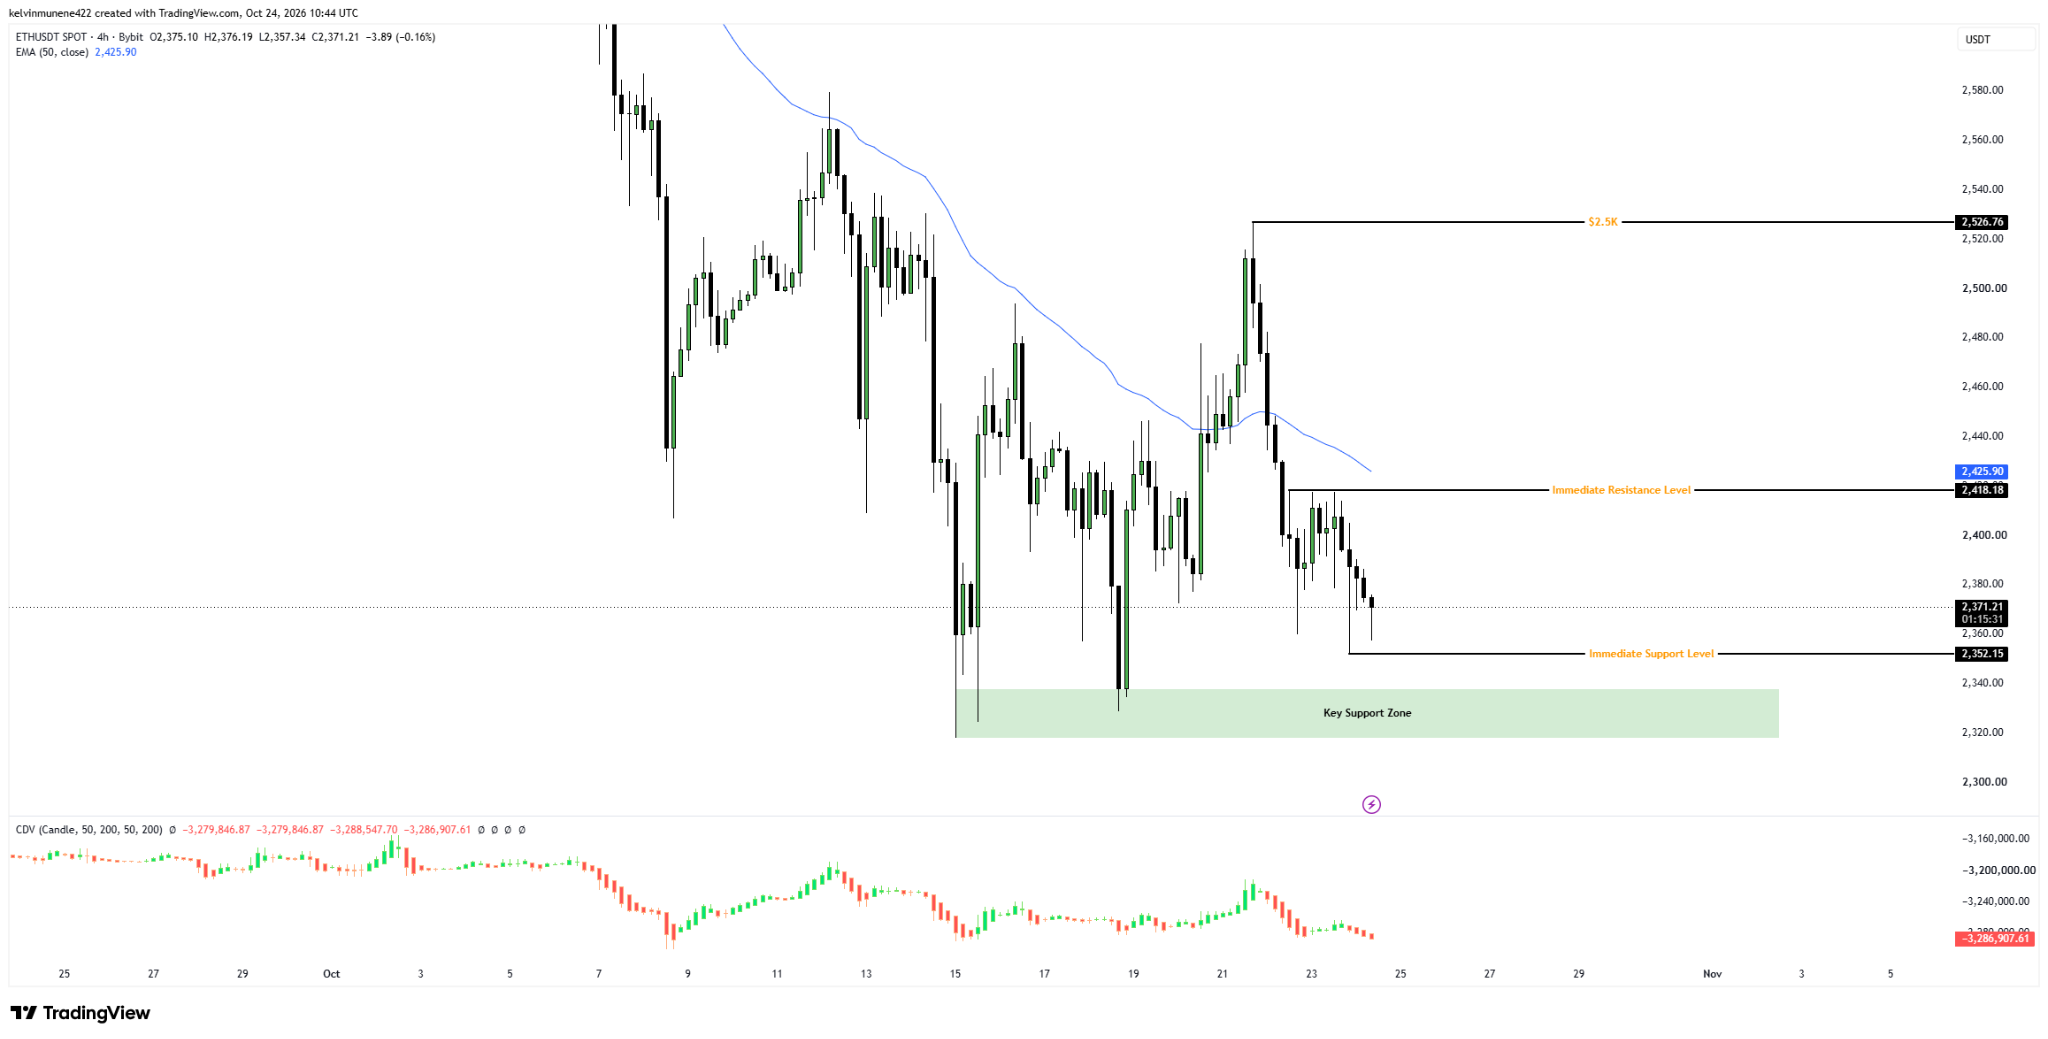
Earlier wicks touched the $2,320–$2,340 zone, but no confirmed sweep beneath $2,300 followed. The token’s price analysis also noted a drifting cumulative volume delta, providing little evidence of aggressive buying. Nonetheless, ETH had yet to reclaim the broken resistance area.
Follow us on X for real-time crypto updates.
Ethereum Recovery Tests $2,418 and $2,425.90 Resistance
For Ethereum, a sustained four-hour recovery above $2,418 and the moving average would weaken immediate bearish pressure, with the higher reference remaining at $2,500. Conversely, losing $2,352 would bring the broader $2,300 demand area into sharper focus. Moreover, COINOTAG identified $2,150 as a lower reference should that demand area fail.
Against this backdrop, ETH’s price analysis distinguishes those conditional levels from confirmed outcomes. Meanwhile, ETH remained below short-term resistance ahead of the Federal Reserve’s October 27–28 meeting, which could introduce further market volatility.
Key Technical Levels
| Price Level | Technical Significance |
| $2,500 | Recovery target |
| $2,425.90 | 50-period EMA resistance |
| $2,418 | Recovery confirmation level |
| $2,352.15 | Immediate support |
| $2,300 | Major demand area |
| $2,150 | Lower downside target |
Recovery Case
A sustained four-hour reclaim above $2,418 and $2,425.90 would weaken bearish pressure, bringing $2,500 into focus.
Failure Case
However, losing $2,352 could expose $2,300, with $2,150 becoming relevant if demand fails.
FAQs
Available data favor deleveraging, not confirmed widespread liquidations.
Traders are closing futures positions, reducing leverage and outstanding contracts.
Immediate support stands at $2,352.15, followed by broader $2,300 demand.
A sustained four-hour reclaim above $2,418 and $2,425.90 supports recovery.
Subscribe to our YouTube channel for the latest crypto news.
Disclaimer: The information presented in this article is for informational and educational purposes only. The article does not constitute financial advice or advice of any kind. Coin Edition is not responsible for any losses incurred as a result of the utilization of content, products, or services mentioned. Readers are advised to exercise caution before taking any action related to the company.