






- Ethereum trades near $1,900 as a double bottom pattern strengthens the short-term outlook.
- Trendline breakout targets $1,992 and $2,150 while buyers defend key support levels.
- RSI and MACD remain positive as Ethereum extends gains with rising market momentum.
Ethereum continued to strengthen during the latest trading session as technical indicators pointed to positive momentum while analysts monitored whether the cryptocurrency could extend its recovery above key resistance levels. The asset traded at $1,880.58, up 4.66% over the past 24 hours, with daily trading volume reaching $14.26 billion, according to CoinMarketCap.
The current trend comes as chart analysts identified developing technical patterns that could influence Ethereum’s next move. At the same time, recent inflation data has improved the backdrop for risk assets, while expectations have emerged that Ethereum exchange-traded funds could record monthly net inflows after eight consecutive months of net outflows.
Ethereum Double Bottom Pattern Draws Market Attention
According to analysis shared by BIT Official Chinese, Ethereum is forming a double bottom pattern after rebounding from a long-term support zone near $1,500. The pattern has left traders with a clearly defined technical support area while leading to an uptrend in the cryptocurrency’s short-term outlook, provided prices remain above recent lows.
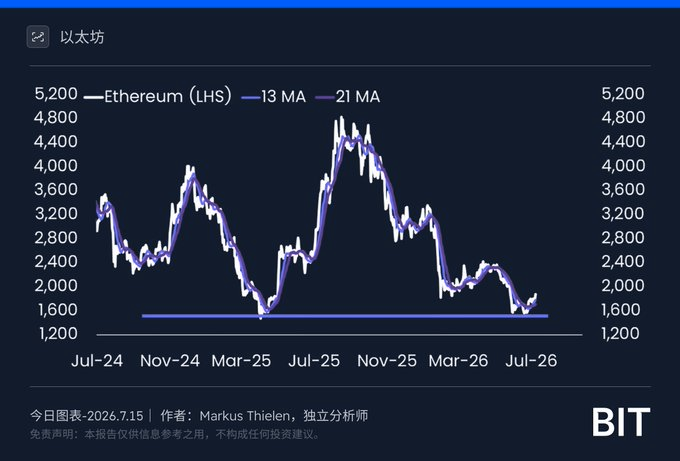
A longer-term chart covering July 2024 through July 2026 shows Ethereum recovering after falling below $2,000 earlier this year. The recovery follows an extended correction that erased gains made during a rally that pushed the asset close to $4,800 in the second half of 2025. Although both the 13- and 21-period moving averages have started to flatten alongside the recent rebound, Ethereum remains below previous cycle highs.
Breakout Attempt Targets Higher Resistance
Crypto analyst GT also highlighted rising price structure, stating that Ethereum has confirmed a breakout above a descending trendline after forming a series of higher lows throughout June and July.
The chart places the first upside objective at $1,992.22, followed by resistance around $2,150.68 if buying momentum continues. An extended projection shows $2,600 as a higher target. However, the chart also shows that long-term trading above the previous trendline is required to confirm the breakout.
Technical Indicators Remain Positive
Technical indicators continue to back the latest recovery. Ethereum’s 14-day Relative Strength Index stands at 63.13, while its RSI moving average is 56.63, indicating strengthening buying momentum without reaching overbought conditions.
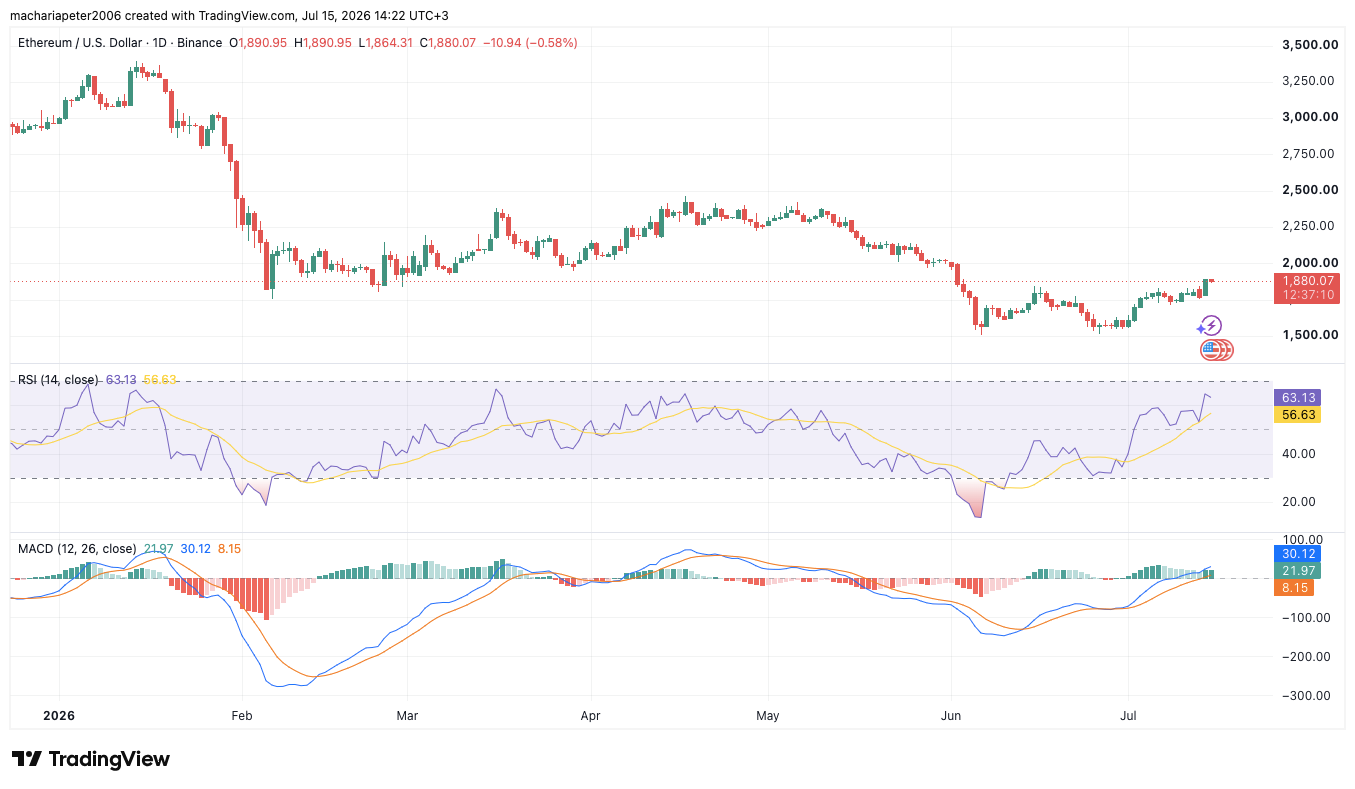
The Moving Average Convergence Divergence indicator also remains positive. The MACD line stands at 30.12, while the signal line is at 8.15, and the positive histogram has expanded to 21.97, reflecting continued bullish momentum following the recent crossover.
Related: Ethereum Price Prediction: Will Morgan Stanley’s Staking ETH ETF Push ETH Past $1,950?
Disclaimer: The information presented in this article is for informational and educational purposes only. The article does not constitute financial advice or advice of any kind. Coin Edition is not responsible for any losses incurred as a result of the utilization of content, products, or services mentioned. Readers are advised to exercise caution before taking any action related to the company.




